⚡ ICP Price Context: Bullish Structure Taking Shape
ICP is showing a clear transition from bearish to bullish structure, with price moving away from a prolonged downtrend. The recent breakout indicates that momentum is shifting, opening the door for a potential continuation move.
However, the opportunity lies not in what has already happened, but in what may come next.
📈 Chart Explanation: Clean ABC Formation
The chart presents a well-defined ABC pattern, a common structure in trending markets.
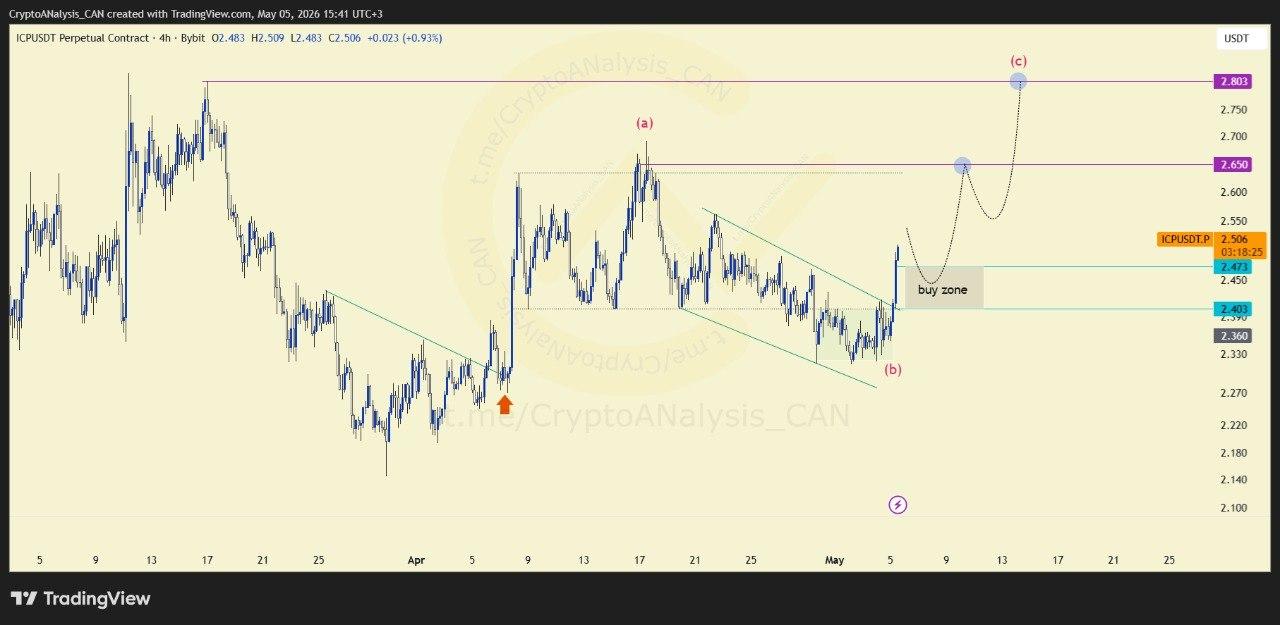
The first move (Wave A) marked the breakout above the descending trendline, signaling the initial shift in momentum. This was followed by Wave B, a controlled pullback within a descending channel, allowing the market to reset.
Now, the focus shifts to Wave C, typically the strongest and most tradable leg of the structure.
🎯 Entry Decision: Positioning for Wave (C)
This setup is focused on capturing the third bullish leg (Wave C).
The ideal entry comes after confirmation that the pullback has completed and price is beginning to move upward again.
👉 No confirmation = no entry
Waiting for signs of strength ensures that you are entering with momentum, not anticipation.
💰 Execution Plan: Trade with Caution
Due to the nature of this setup, risk management becomes even more important.
Stop-loss placement can be less straightforward in this structure, which means traders should compensate by using lower leverage and controlled position sizing.
The goal is to stay in the trade without exposing yourself to unnecessary risk.
📈 Outlook: Potential for Strong Continuation
If Wave (C) develops as expected, ICP could see a strong bullish expansion toward higher target levels.
However, if the structure fails, price may extend the consolidation phase before attempting another move. Flexibility remains key.
📢 Stay Ahead of the Market
The best moves come from understanding structure, not chasing price.
Join our Telegram for real-time analysis, wave setups, and high-probability opportunities.
👉 Wait for confirmation. Ride the wave.