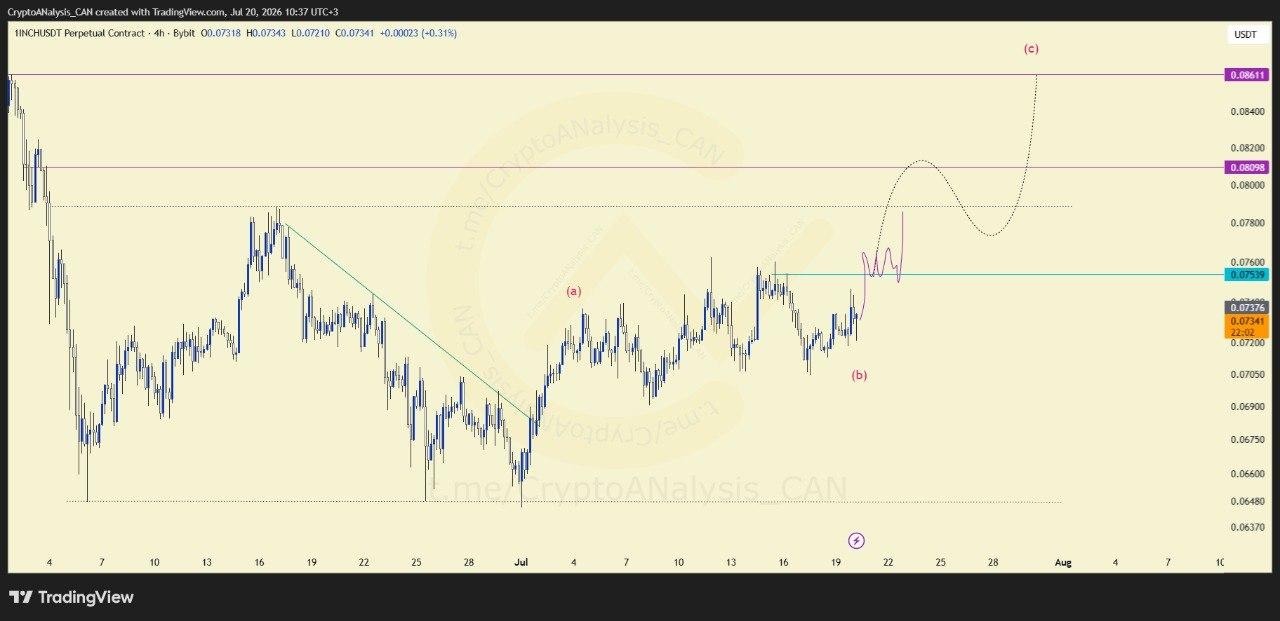
⚡️ Market / Price Context
1INCH/USDT broke above its descending trendline, initiating a bullish (abc) pattern aimed at higher resistance zones on the 4H chart. Since that breakout, price has spent considerable time ranging under what's identified as wave (b), building out the corrective phase of the structure.
📈 Chart Explanation
For this (abc) pattern to remain valid, the extended time spent ranging under wave (b) now needs to resolve with a break to higher levels, marking the start of wave (c). Without that break, the pattern's bullish continuation thesis stays unconfirmed despite the earlier trendline breakout.
📈 Outlook
The critical level to watch is the highlighted resistance zone above current price. Only a confirmed break above it would validate wave (c) getting underway and support the case for continuation toward higher resistance. Until that happens, the structure remains in a waiting phase, with the resistance zone serving as the clearest reference point.
