⚡️ Market / Price Context
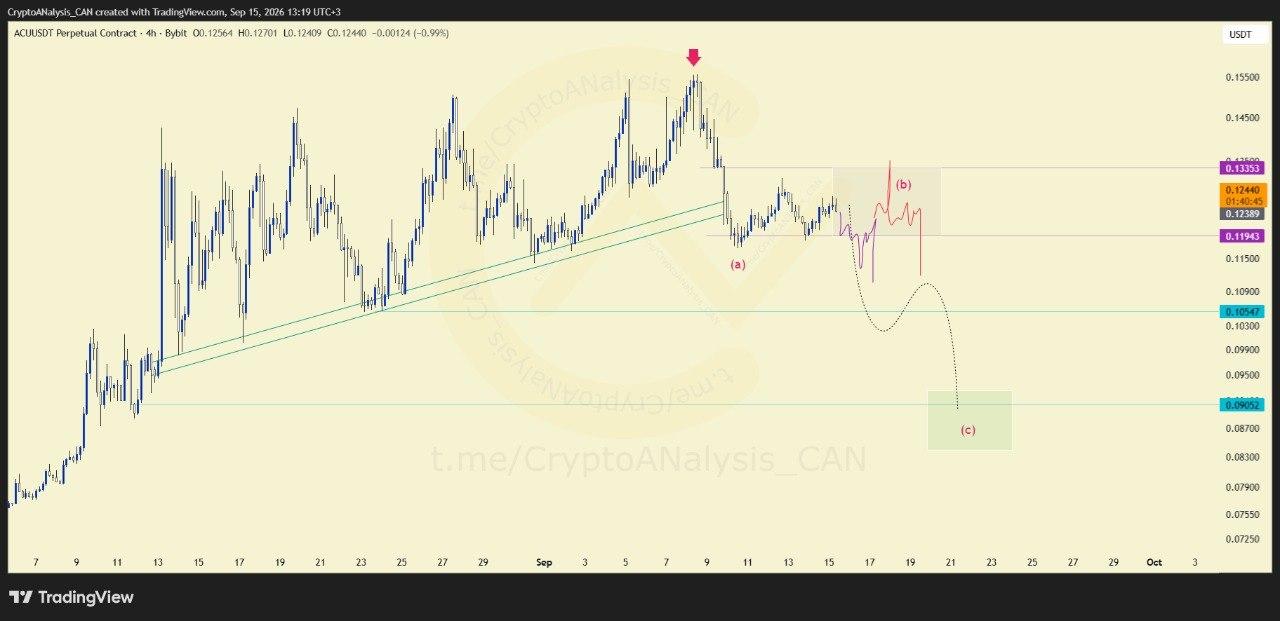
ACU has demonstrated a structural transition, shifting from its prior directional trajectory into a broader bearish framework. This change in market structure reflects reduced upward momentum, leading into an intermediate consolidation phase identified as Wave (b).
📈 Chart Explanation
From a technical analysis perspective, a multi-phase corrective structure develops in sequenced stages. As Wave (b) develops, analysts observe directional validation through swing points. Specifically, the establishment of a verified lower low serves as structural confirmation that the consolidation phase has run its course and the broader corrective pattern is actively resuming.
📈 Outlook
If the formation confirms a lower low, price dynamics typically progress toward the development and completion of Wave (c). Within disciplined charting frameworks, tracking this phase requires structured risk management principles to monitor structural invalidation levels until stabilization occurs.
