⚡️ Market/Price Context
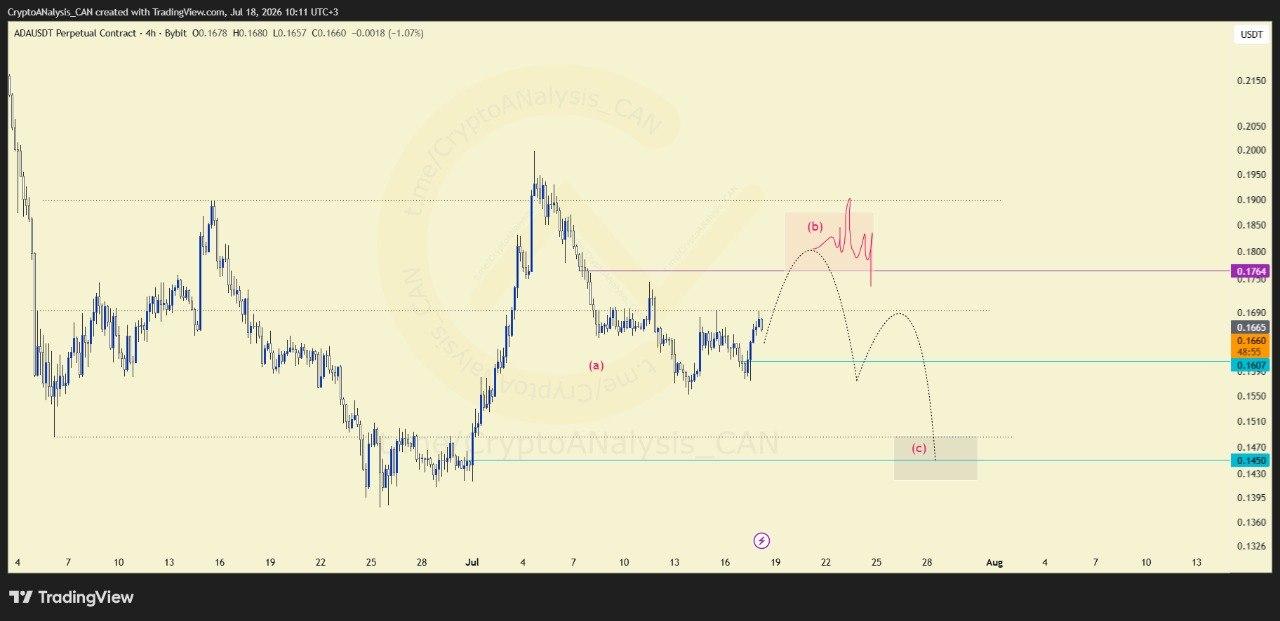
ADAUSDT's early July recovery was significantly eroded by a strong selling wave, labeled wave (a), which erased close to half of the prior gains. Since that decline, price has moved into a ranging phase on the 4H chart rather than continuing directly lower.
📈 Chart Explanation
This ranging behavior suggests sellers are working through wave (b), a corrective pause often used to secure better pricing before a potential continuation move. The highlighted technical zone represents where this wave (b) phase is expected to complete, giving sellers the improved levels they appear to be seeking.
📈 Outlook
If the highlighted zone holds as resistance, it would support the case for sellers resuming control from better pricing. However, a complete break of that zone with buyers establishing a bullish structure above it would invalidate this read entirely, shifting the bias away from continued downside.
