⚡️ Market / Price Context
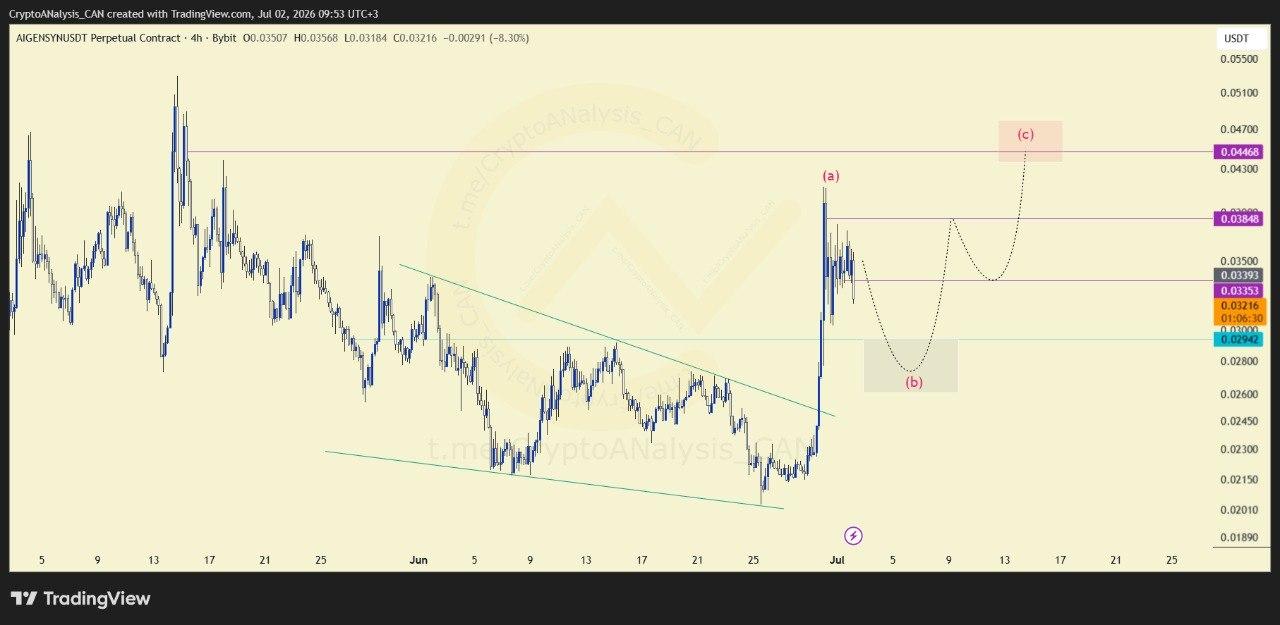
AIGENSYN has broken above a highlighted triangle pattern on the 4-hour timeframe, signaling a shift in market structure. However, the breakout has been followed by range-bound candles, indicating that momentum is slowing as the market digests recent gains.
📈 Chart Explanation
The current consolidation suggests that price may be preparing for a corrective move rather than an immediate continuation. The highlighted support zone is identified as the technical area where Wave (b) could develop before the expected start of Wave (c).
📈 Outlook
The breakout structure remains constructive, but near-term consolidation may continue before momentum returns. A healthy pullback could provide the foundation for the next upward leg.
