⚡️ Market / Price Context
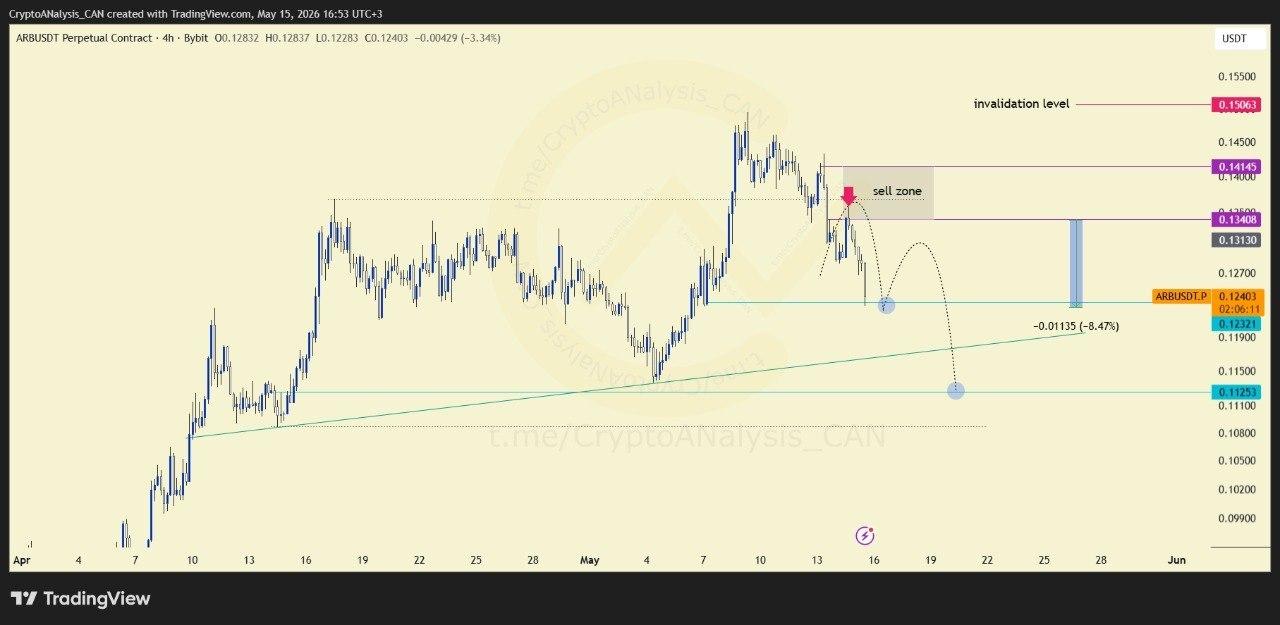
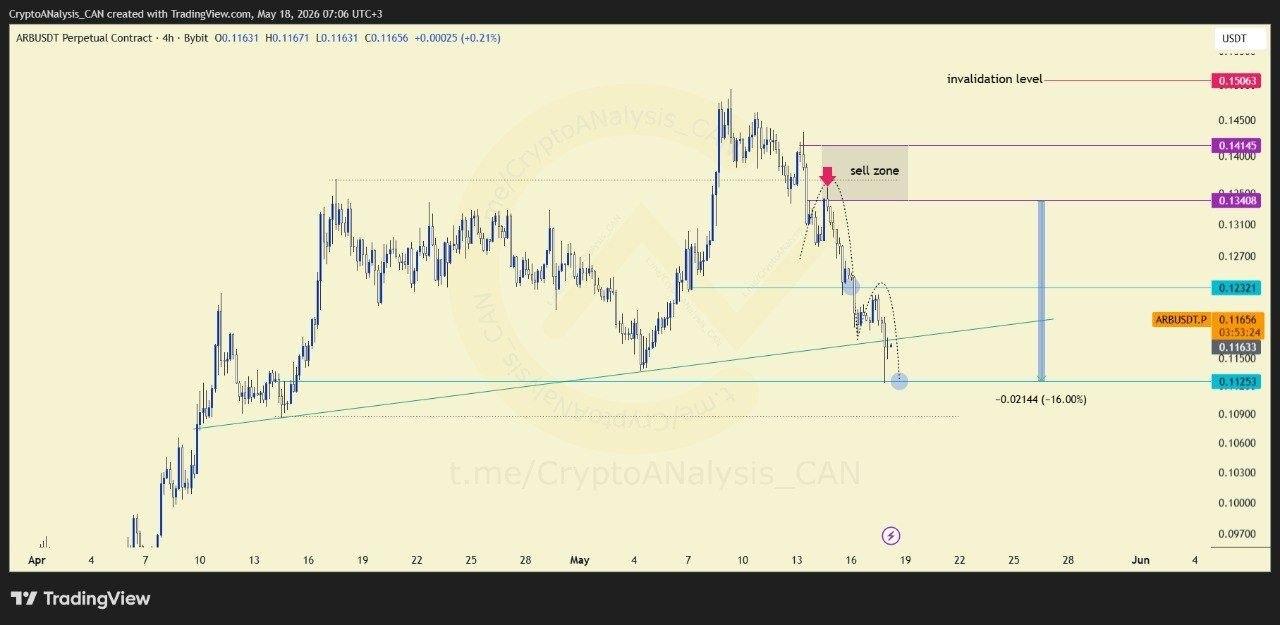
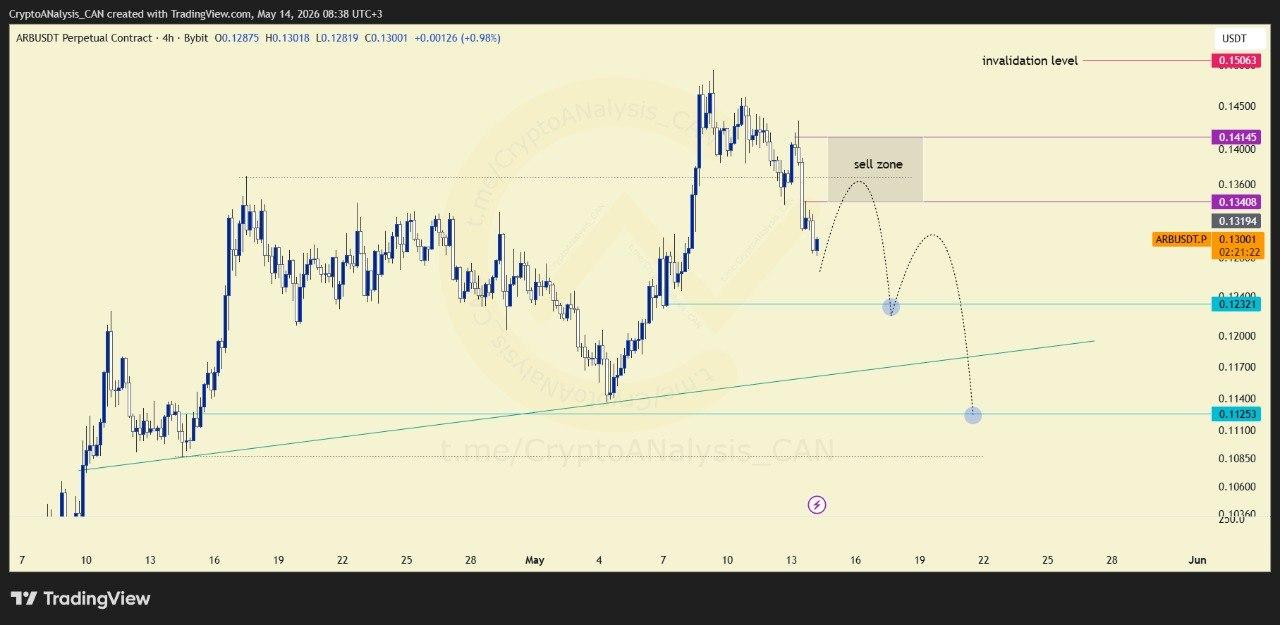
ARB/USDT is displaying a familiar pattern on the 4H chart: after a strong recovery rally, price often enters a phase of swing-based pullbacks rather than continuing in a straight line. This alternating rhythm of advances and retracements is a common feature of trending markets working through profit-taking and repositioning.
📈 Chart Explanation
These swing moves typically bring price back down to technical zones, areas where prior structure or support may come into play. Rather than viewing each pullback as a trend reversal, this phase is better understood as part of the broader recovery's natural rhythm, with each leg down potentially offering a fresh technical reference point.
📈 Outlook
As this pattern unfolds, technical zones formed during pullbacks become the key areas to watch. Managing exposure step by step and defining clear invalidation points remain central to navigating this type of swing structure, since sustained moves below those zones would signal a shift away from the current pattern.