⚡️ Market / Price Context
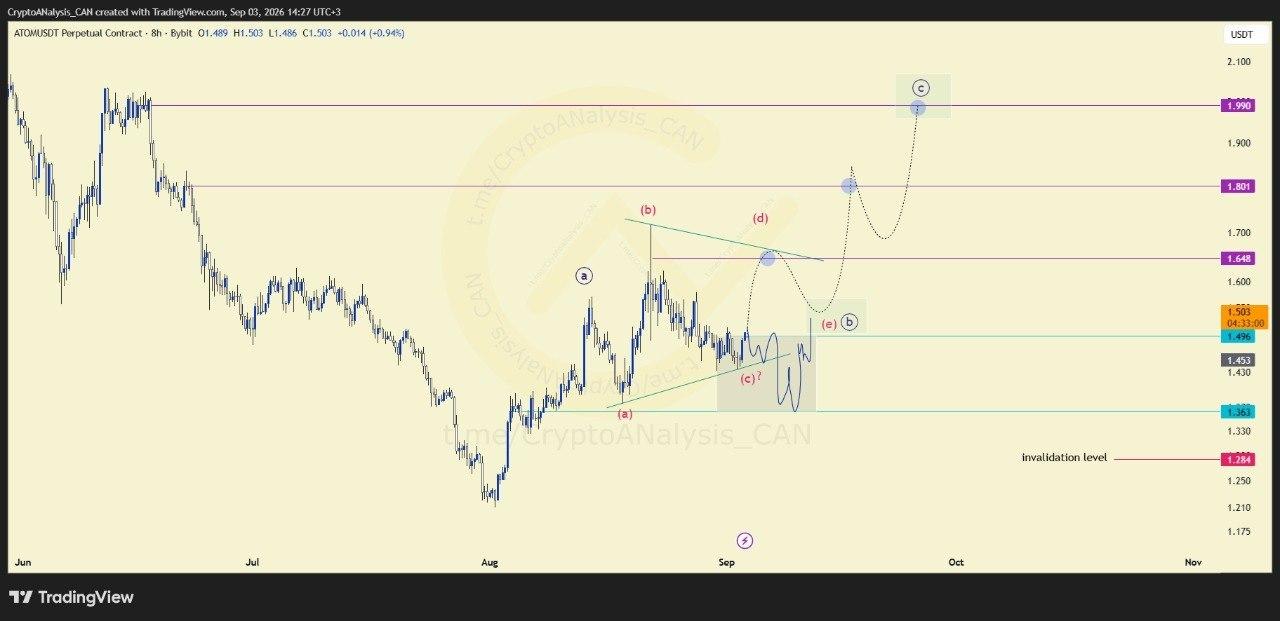
ATOM is forming a triangle pattern on the 8-hour timeframe, a consolidating structure often associated with a continuation move once the pattern completes. This setup points toward the possibility of price extending to higher levels.
📈 Chart Explanation
The structure is centered around wave (c), which represents the key leg within the developing triangle. As this wave forms, it's expected to guide price upward in line with the broader pattern. The triangle's shape itself reflects a narrowing range, typical of consolidation phases that often precede a more decisive directional move.
📈 Outlook
As long as price holds above the defined invalidation level, the triangle pattern remains structurally intact, supporting the case for wave (c) to develop as planned. A break below that level would invalidate the setup, requiring a reassessment of ATOM's short-term structure.
