⚡️ Market / Price Context
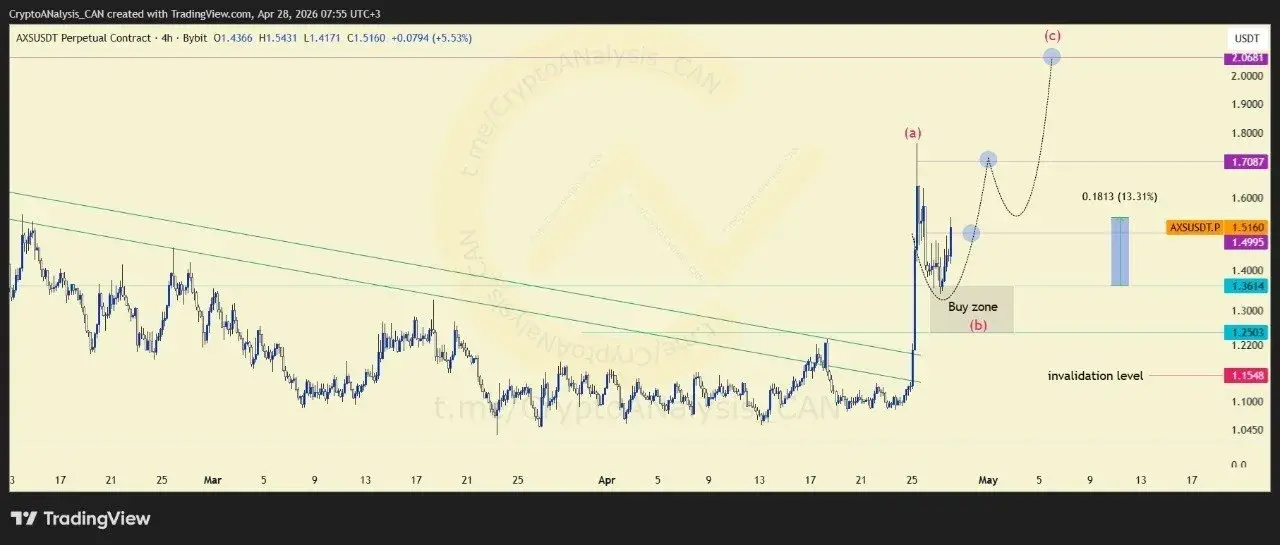
AXS has delivered a strong technical development by breaking above a descending trendline that had remained in place for approximately three months. This breakout represents a notable shift in market structure and has increased attention on the asset's near-term trajectory.
📈 Chart Explanation
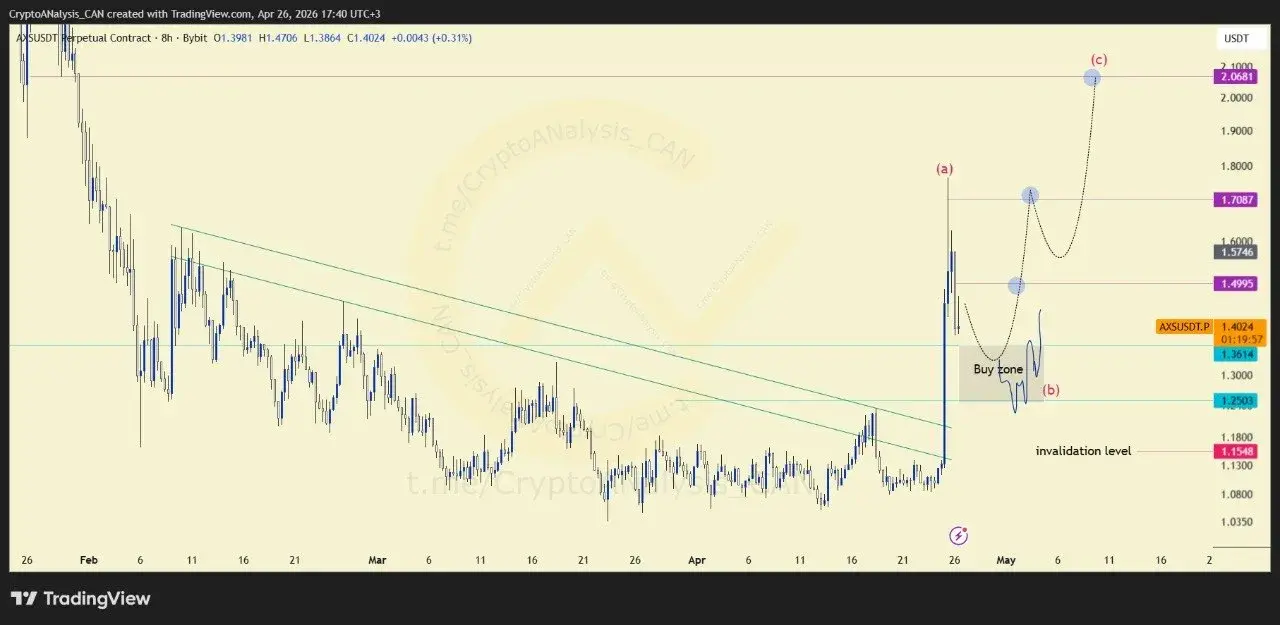
The roadmap outlines a common three-phase market sequence. The first stage is an impulsive breakout that establishes bullish momentum. The second stage is a pullback phase, allowing the market to consolidate and cool off after the initial surge. The final stage is a follow-up wave that extends the broader move.
According to the analysis, the market is expected to progress through this sequence before completing the setup.
🎯 Entry Decision
Rather than entering immediately after the breakout, the preferred approach is to wait for the pullback phase. This provides an opportunity to evaluate entries after the initial momentum wave has matured and risk can be assessed more effectively.
💰 Execution Plan
The trading plan focuses on positioning during phase (b), the corrective pullback. Orders can be prepared around this stage while incorporating predefined stop-loss levels, position sizing, and risk-management parameters before the anticipated continuation wave develops.
📈 Outlook
The breakout above a long-term descending trendline has improved the technical outlook for AXS. The next key development is whether the expected pullback phase unfolds and creates the foundation for a follow-up bullish wave.
📢 Stay Ahead of the Market
Breakouts create opportunity while pullbacks create entries.
Join our Telegram for real-time analysis, precise entries, and high-probability setups before the next move unfolds.
👉 Wait for the pullback. Ride the wave.