⚡️ Market / Price Context
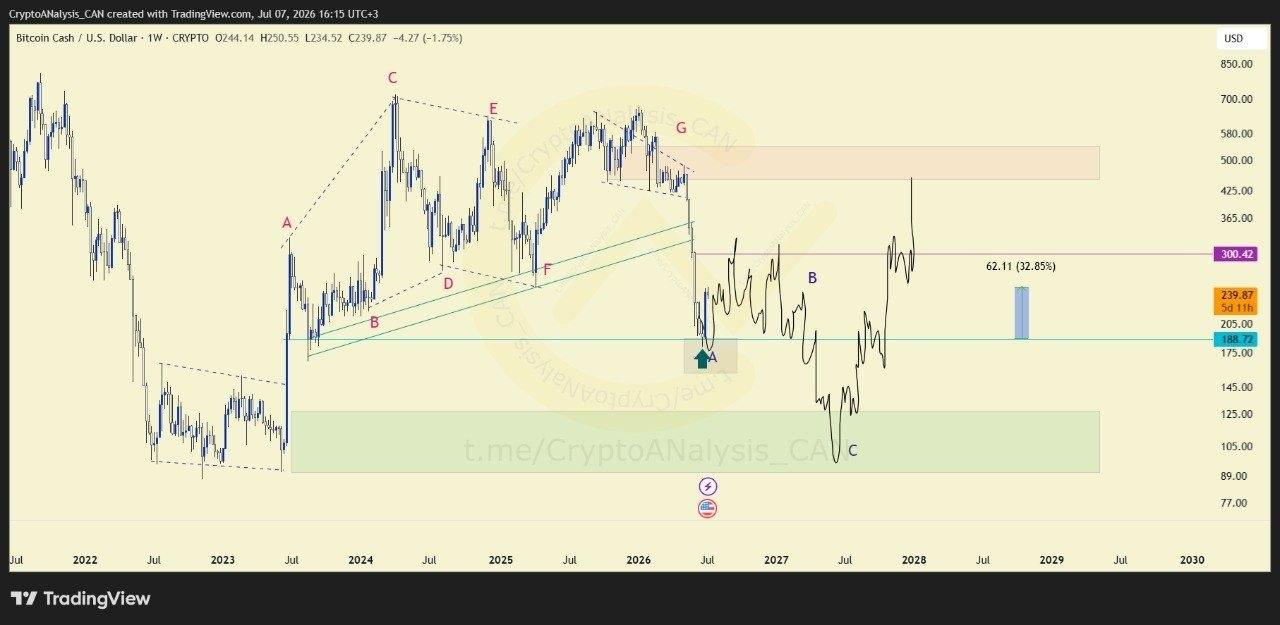
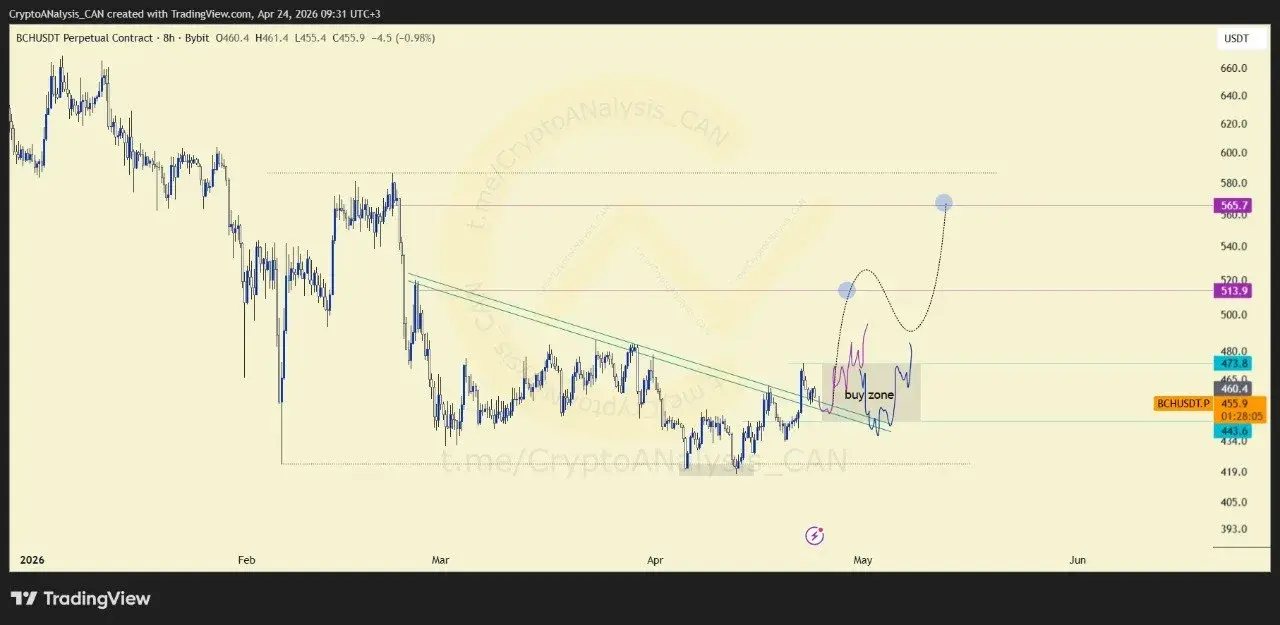
Bitcoin Cash has begun to attract attention after establishing a constructive market structure on the 8-hour chart. The asset formed a double bottom at a key liquidity area, suggesting that selling pressure may have weakened at lower levels.
📈 Chart Explanation
The roadmap highlights three important technical developments. First, a double-bottom pattern emerged at the lowest liquidity zone. This was followed by a strong breakout above a descending trendline, signaling a potential shift in market sentiment. Price has since returned to retest the broken trendline, creating a pullback phase within the broader setup.
📈 Outlook
Bitcoin Cash has established several bullish technical signals, but confirmation remains essential. The market outlook depends on whether momentum can accelerate following the trendline retest and support the next phase of the recovery.