⚡️ Market / Price Context
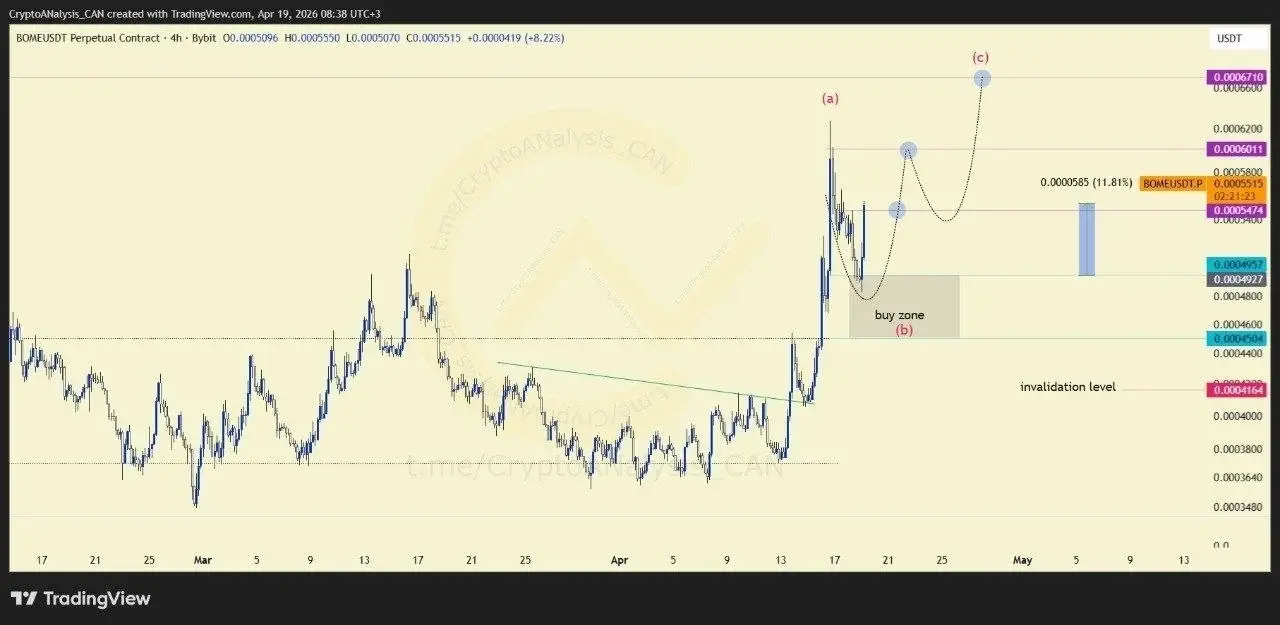
BOME has shifted into a new technical phase after successfully breaking above a previously established trendline. The breakout signals a change in market structure and provides the foundation for the current roadmap.
📈 Chart Explanation
According to the chart structure, the breakout has already been confirmed. The initial advance has been identified as wave (a), marking the first bullish leg of the move. Following that advance, the market entered a pullback phase, currently labeled as wave (b).
This corrective movement is viewed as part of the broader structure rather than a complete invalidation of the bullish outlook.
🎯 Entry Decision
The roadmap highlights a potential buying opportunity tied to the development of wave (c). Traders may prefer waiting for confirmation that the corrective phase is complete before considering participation in the next directional move.
💰 Execution Plan
Risk management remains a central component of the setup. The chart provides a logical invalidation level that can be used to calculate position risk, determine leverage exposure, and establish stop-loss placement before entering the trade.
📈 Outlook
As long as the broader structure remains intact, attention remains focused on whether the current pullback can transition into wave (c). The confirmed breakout keeps the bullish scenario active, while traders continue monitoring price action for confirmation of the next leg higher.