← Back to Analysis

πŸ“‰ BSB Update: TP2 Hit with 35.31% Move; Liquidity Grab Explained

05/02/2026 10:51

⚑️ Market / Price Context

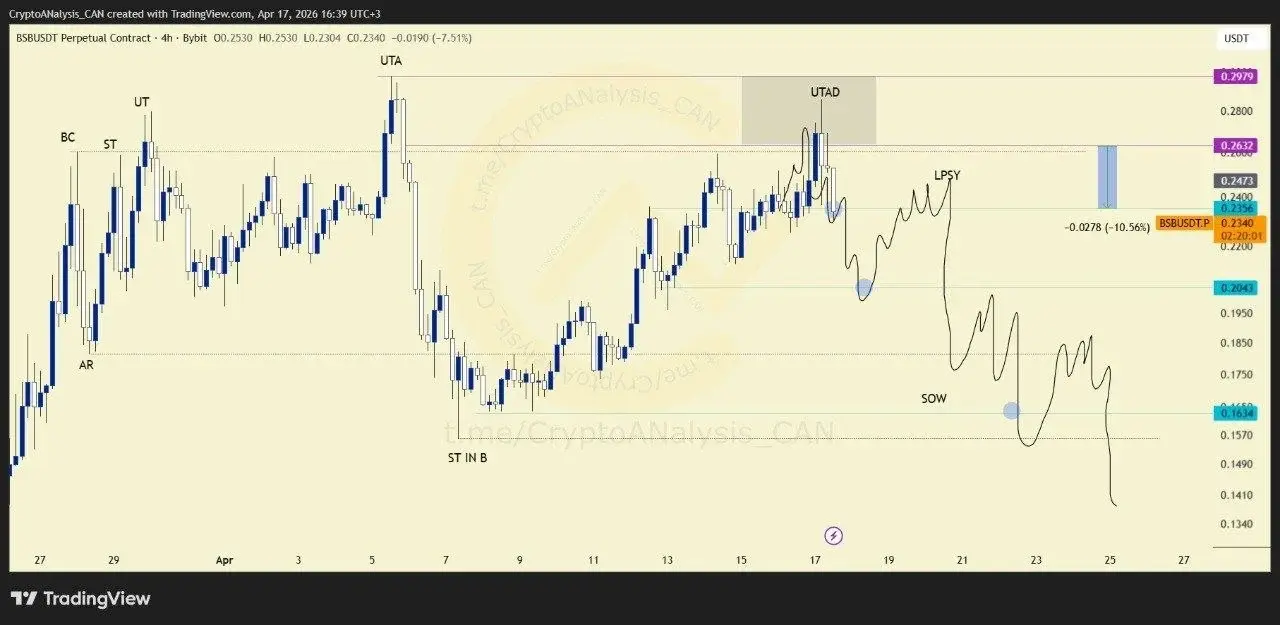
BSB continues to form a corrective market structure on the 4-hour timeframe. The current price action remains consistent with an ABC pattern, a commonly observed formation that often creates trading opportunities as each wave develops.

πŸ“ˆ Chart Explanation

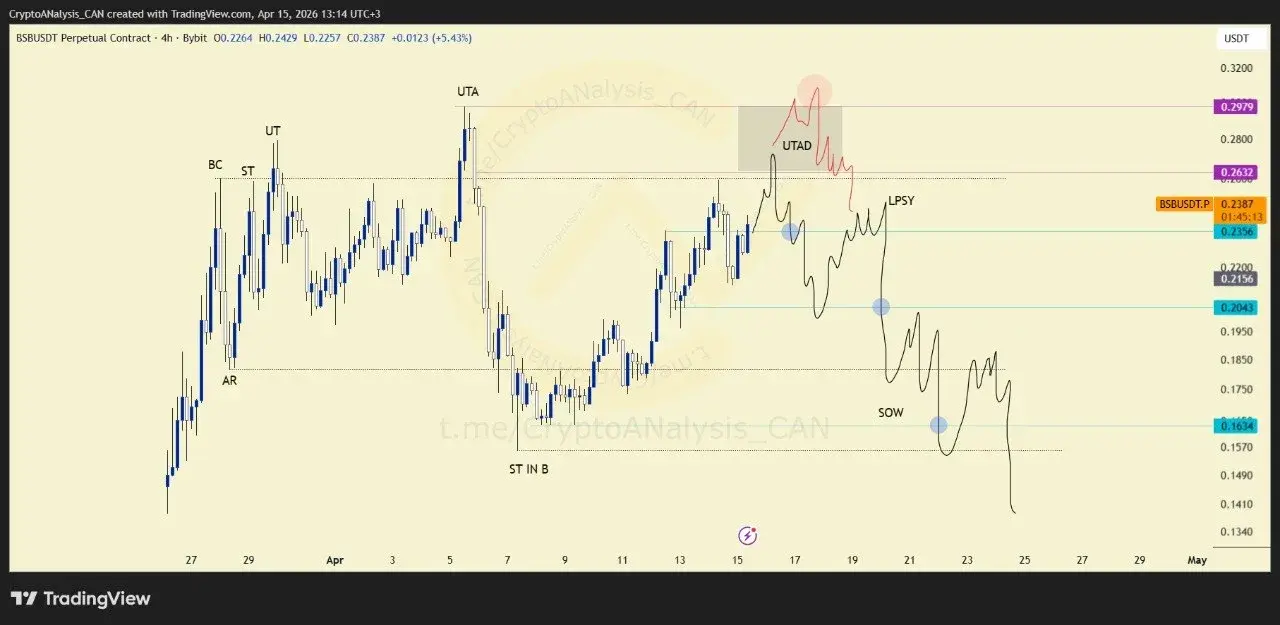
The chart suggests that price is advancing toward the potential completion area of wave (b). Within a standard ABC correction, wave (b) often acts as a retracement before the next leg of the structure unfolds.

This area becomes technically important because it may attract selling pressure if the market begins to show rejection or weakening momentum. However, the corrective pattern is still evolving, meaning confirmation remains essential before drawing conclusions about the next directional move.

🎯 Entry Decision

The current zone may present a potential sell area, but entering prematurely carries elevated risk. Traders should wait for clear signs of rejection or technical confirmation rather than assuming the reversal will occur immediately upon reaching the level.

πŸ’° Execution Plan

A disciplined approach remains critical while the structure develops. Any trade consideration should be supported by confirmation signals, predefined risk parameters, and a well-planned stop-loss strategy to manage uncertainty around the evolving pattern.

πŸ“ˆ Outlook

BSB is approaching a key technical area where wave (b) could reach completion. If rejection develops, the market may begin the next phase of the corrective structure. Until confirmation appears, patience remains the preferred strategy.

  πŸ“² Want high-precision setups with proper risk context?  

Join our Telegram channel and trade smarter, not faster.

Updates

05/05/2026 09:04

πŸ“£ Trade Update

BSB has completed a significant corrective move, reaching TP2 with a 35.31% decline from the analyzed setup. The market followed the projected corrective path despite temporarily moving above the previous high before reversing lower.

🎯 Target Hit

The correction extended far enough to deliver both projected downside targets. Before the decline accelerated, price briefly moved beyond the prior high, collecting liquidity and validating the possibility that wave (b) could complete above the previous peak before the bearish move developed.

πŸ’° Trade Management

This setup demonstrates why certain chart structures do not always have a fixed invalidation level. In some corrective formations, temporary moves beyond key highs or lows remain technically valid within the broader pattern. Maintaining focus on structure rather than reacting to short-term volatility can help traders navigate these situations more effectively.

πŸ“ˆ What’s Next

The successful completion of the corrective roadmap reinforces the importance of monitoring technical clues throughout pattern development. Future opportunities will depend on how price behaves after the current correction matures and whether a new market structure begins to form.

πŸ“’ Stay Ahead of the Market

Understanding structure beats reacting to noise.

Join our Telegram for advanced technical insights, real-time updates, and high-probability setups.

Get Full Access to All Our Content for Free!
You can find our other outlets at the bottom of the website.
Telegram