⚡️ Market / Price Context
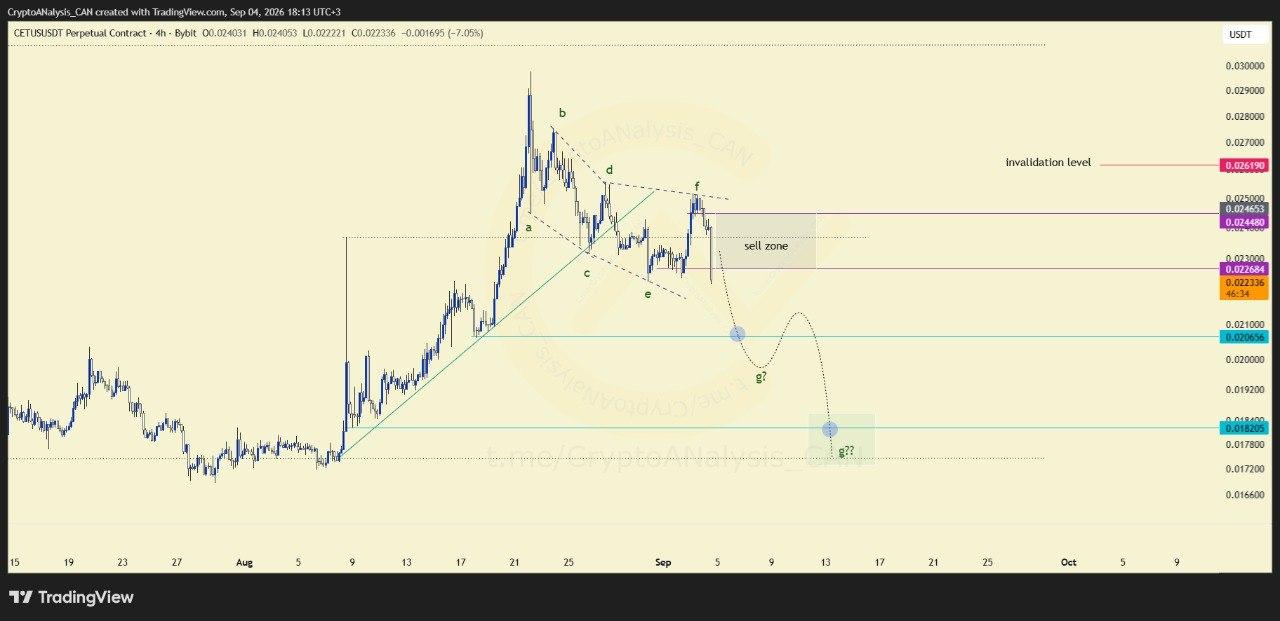
A recent news event appears to have activated the final leg of a Diametric pattern on CETUS's 4-hour chart. This catalyst-driven move has pushed price into a phase that could extend toward lower levels as the pattern completes.
📈 Chart Explanation
As price enters the highlighted technical zone, additional selling interest may join in, reinforcing pressure within the current leg. This zone acts as the structural area where the bearish leg is expected to gain further participation. However, the pattern's validity depends on price staying below the levels marked by previous legs (f) and (d), a move above these would break the structure.
📈 Outlook
If price respects the highlighted zone and stays below the (f) and (d) legs, the bearish leg has room to extend lower. Should price instead push above those prior legs, the pattern would be invalidated, signaling a need to reassess the setup entirely.
