⚡️ Market Context
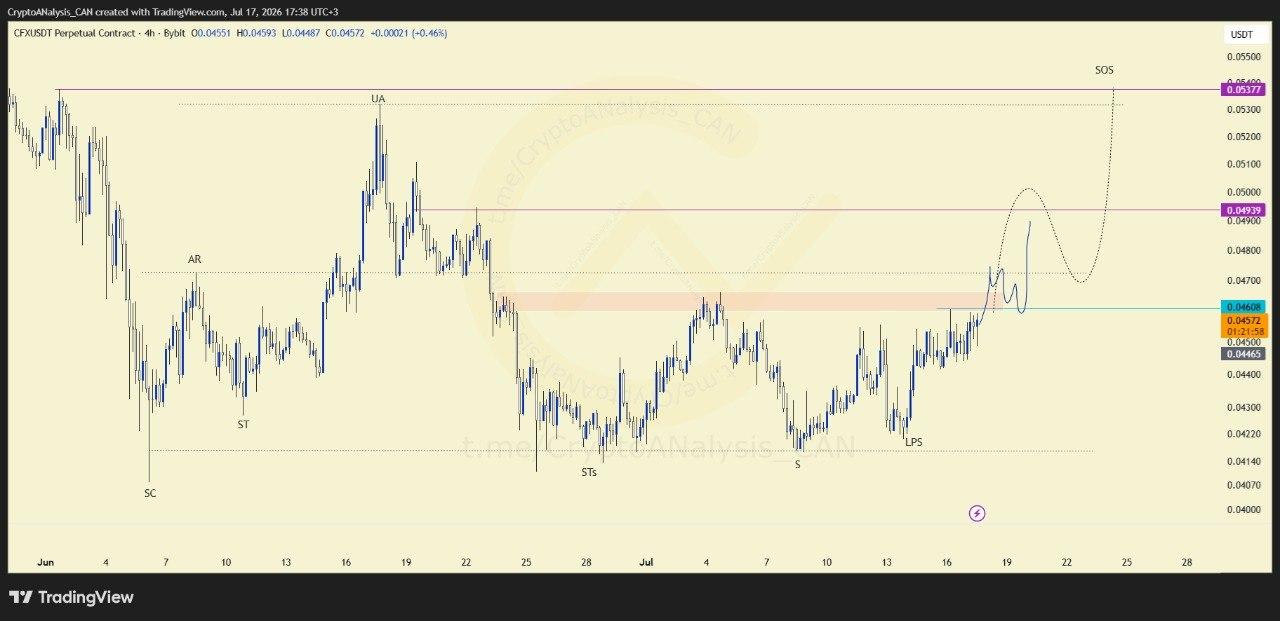
CFX is displaying characteristics of a Wyckoff accumulation structure on the 4H chart, having recently touched its Last Point of Support (LPS). This level typically represents the final low-risk support test before a market attempts its next advance.
📈 Chart Explanation
Following that LPS touch, price is now pressing into a critical resistance area, an early indication that the structure may be transitioning toward the Sign of Strength (SOS) phase. In Wyckoff theory, SOS marks the point where buyers demonstrate clear dominance, typically following a successful LPS test like the one just seen.
📈 Outlook
Confirmation isn't in place yet, the SOS phase remains invalid until price breaches the highlighted resistance zone and that zone flips into support. Until that shift occurs, this stays a developing structure, with the resistance zone serving as the clearest marker for validating the next phase.
