⚡️ Market / Price Context
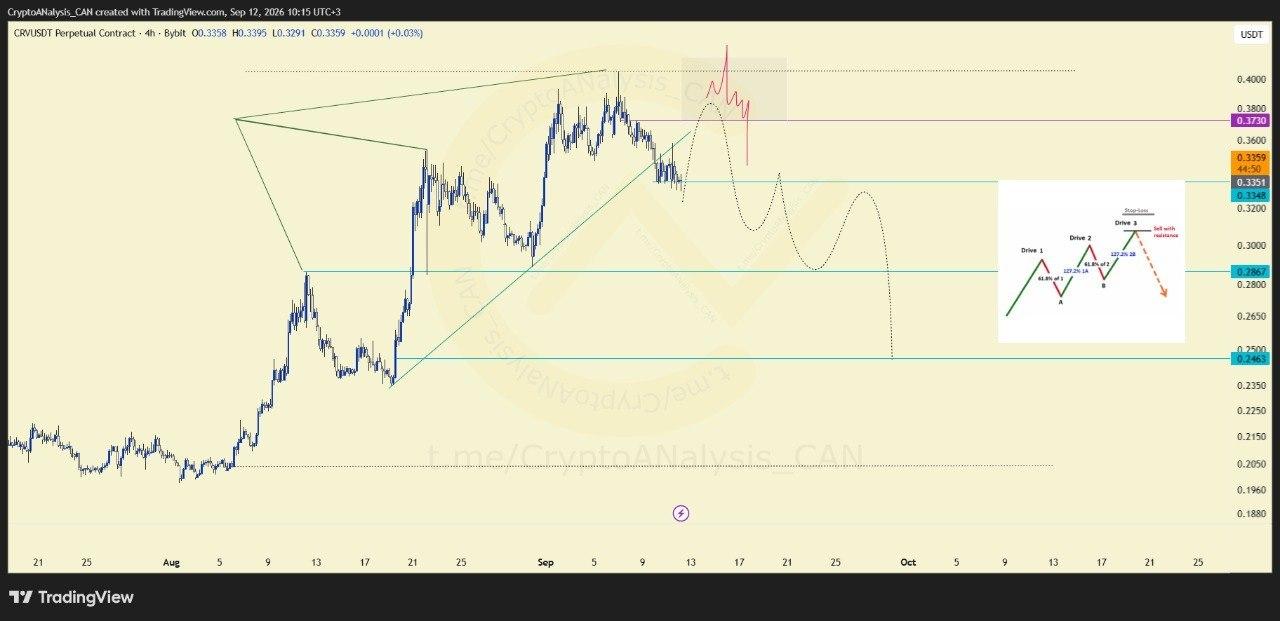
CRV is currently exhibiting structural developments consistent with a potential bullish 3-drive pattern on the intermediate timeframe. This formation suggests the market is completing a sequence of cyclical momentum phases, with the current price action setting up the foundational structure for the final Drive 3.
📈 Chart Explanation
In classical technical analysis, a 3-drive pattern represents a symmetrical formation where price completes three distinct structural pushes before a broader directional shift occurs. Additionally, the current chart highlights a previously broken trendline. When an asset breaches a key structural support line, technical theory dictates that any subsequent upward retracement toward that boundary often transforms the broken line into a new resistance threshold.
📈 Outlook
From an educational standpoint, the interaction between the final leg of the 3-drive pattern and the broken trendline is a critical area of study. If price retraces upward to test this newly established resistance zone, analysts will observe how market momentum reacts at the boundary. Validating whether this structural ceiling holds is essential for confirming the next distinct phase of the broader market cycle.
