⚡️ Market / Price Context
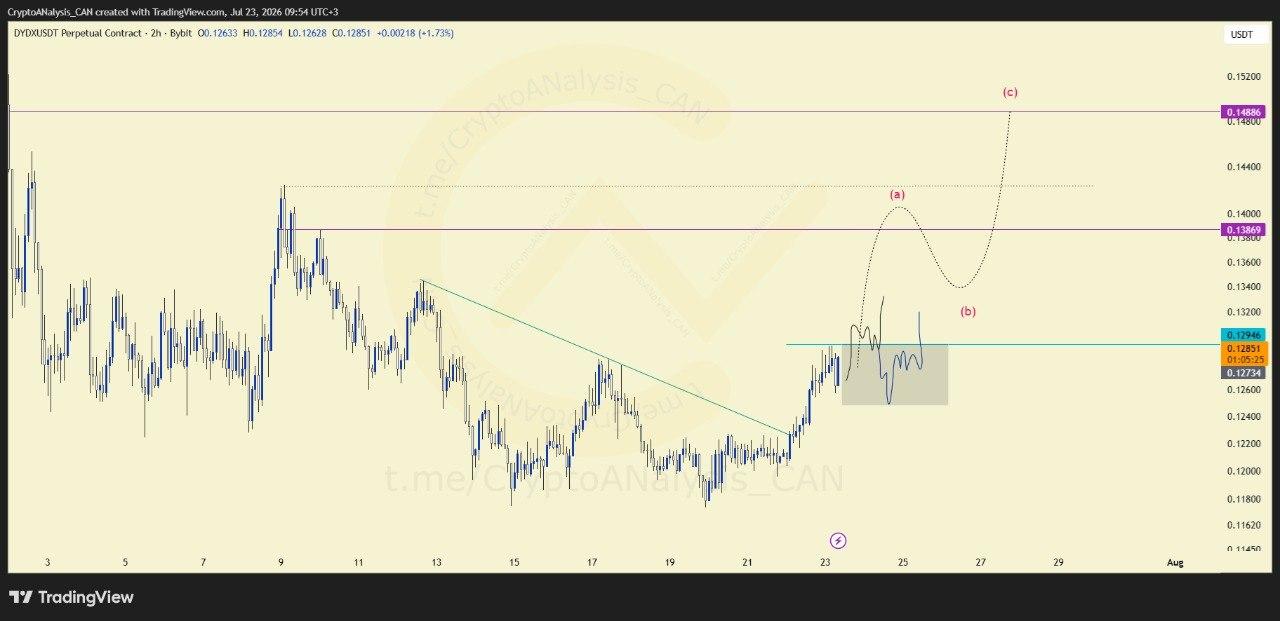
DYDX/USDT has broken out of a descending trendline on the 2H chart, a structural shift that often precedes a change in short-term bias. This breakout sets the stage for a potential bullish move, provided the price action that follows confirms the shift.
📈 Chart Explanation
The developing structure resembles an (abc) pattern, a corrective sequence often used as part of an exit strategy that can offer up to two distinct target zones under waves (a) and (c). A key highlighted zone now serves as the level to watch; price needs to hold above it to validate the pattern taking shape.
📈 Outlook
Confirmation hinges on whether price can sustain momentum above the highlighted zone. If it does, the broader box formed by that zone becomes an area of technical interest, provided proper risk management is applied throughout. Until that confirmation arrives, the breakout remains a developing setup rather than a completed structure.
