⚡️ Market / Price Context
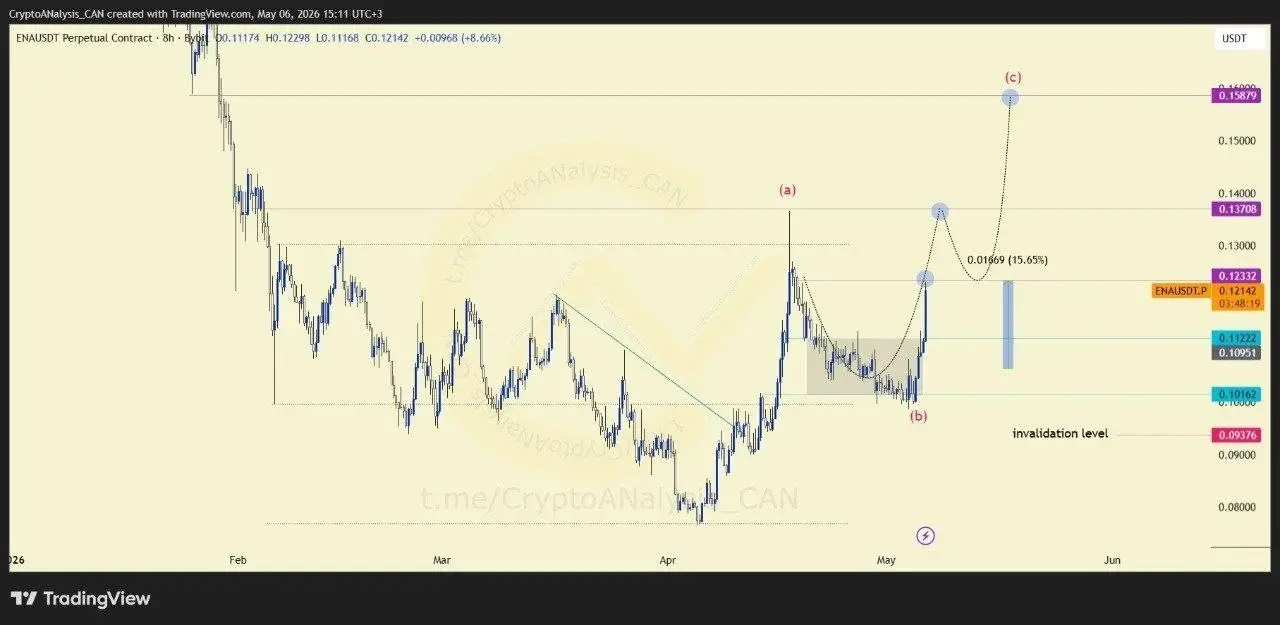
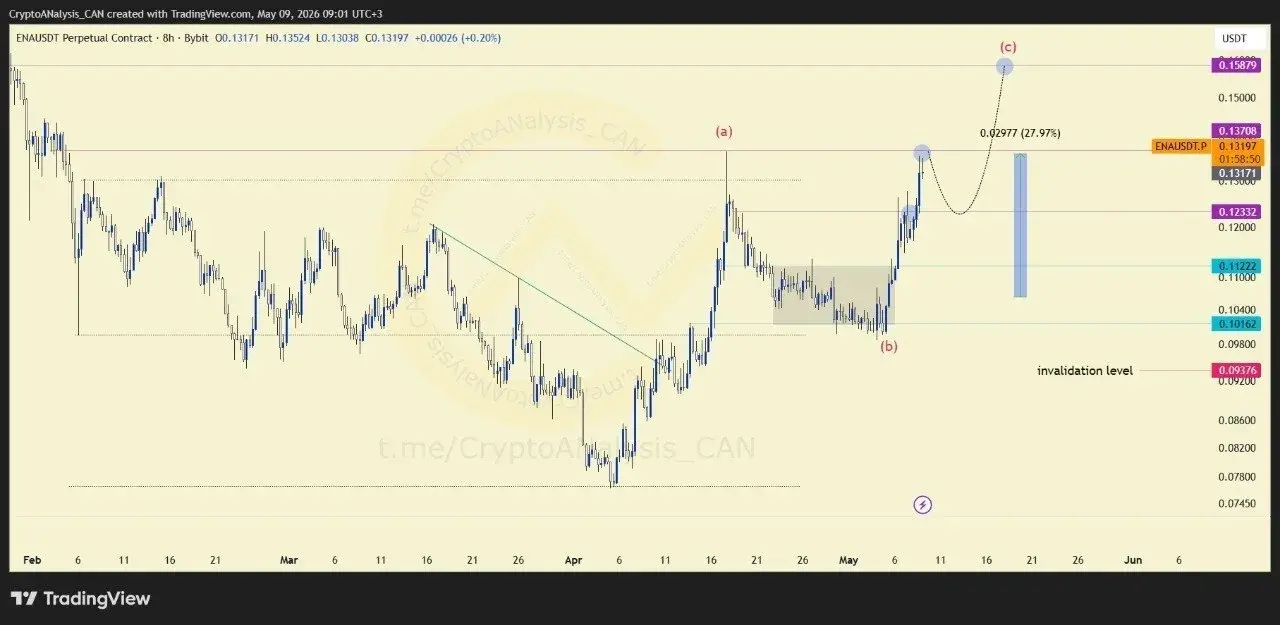
ENA is showing constructive price action after breaking above a descending trendline. The breakout suggests a shift in momentum, with buyers successfully pushing price toward higher resistance levels and challenging the previous bearish structure.
📈 Chart Explanation
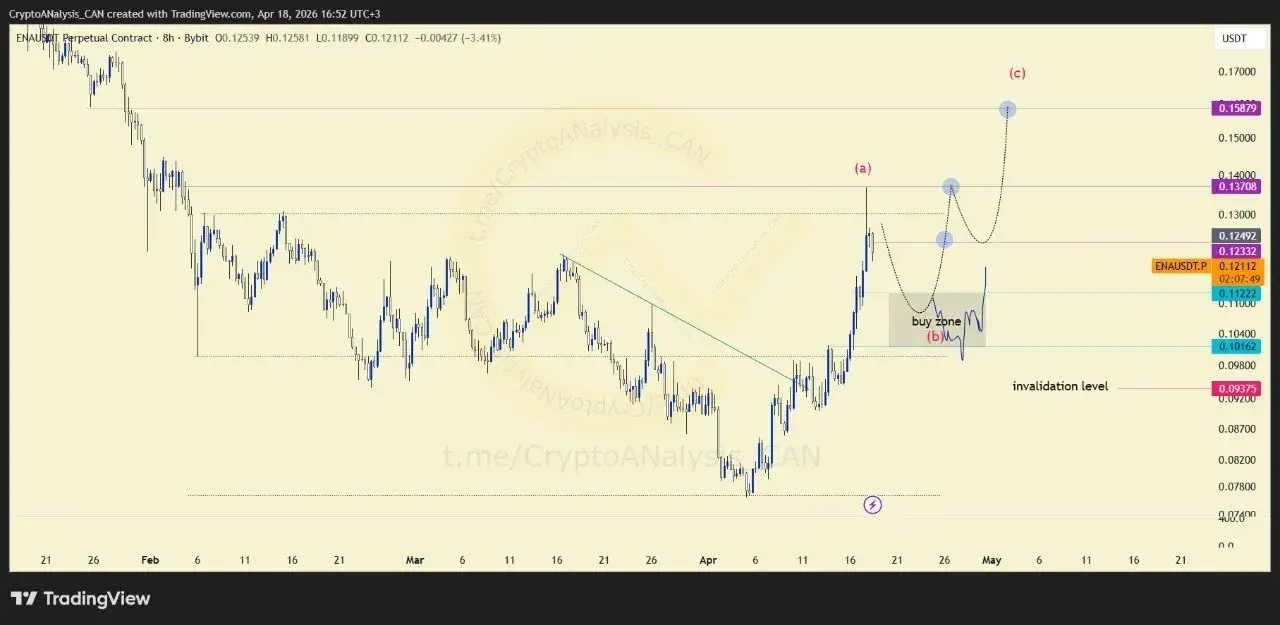
The move above the descending trendline appears to have initiated a bullish wave (a), which has already carried price into an area of stronger resistance. This reaction confirms that buyers have regained short-term control, although resistance remains a key factor to monitor.
🎯 Entry Decision
Rather than focusing solely on price direction, the setup emphasizes risk evaluation before entering the market. Traders should assess potential stop-loss distance from each planned entry and determine whether the reward profile justifies participation.
💰 Execution Plan
A structured approach involves distributing buy orders within the identified buy zone while accounting for risk tolerance, position sizing, and leverage considerations. The goal is to maintain controlled exposure rather than chasing momentum after the breakout.
📈 Outlook
As long as price remains supported following the trendline breakout, the bullish structure remains intact. The market's reaction around higher resistance levels will likely determine whether the current upward phase can continue.
📢 Stay Ahead of the Market
Good trades start with good planning.
Join our Telegram for real-time setups, precise entries, and structured trading strategies.
👉 Define your risk. Execute with confidence.