⚡️ Market / Price Context
Ethereum has continued to underperform Bitcoin, reflecting persistent relative weakness on the ETHBTC pair. However, the current structure suggests that this trend could be approaching an important stage.
📈 Chart Explanation
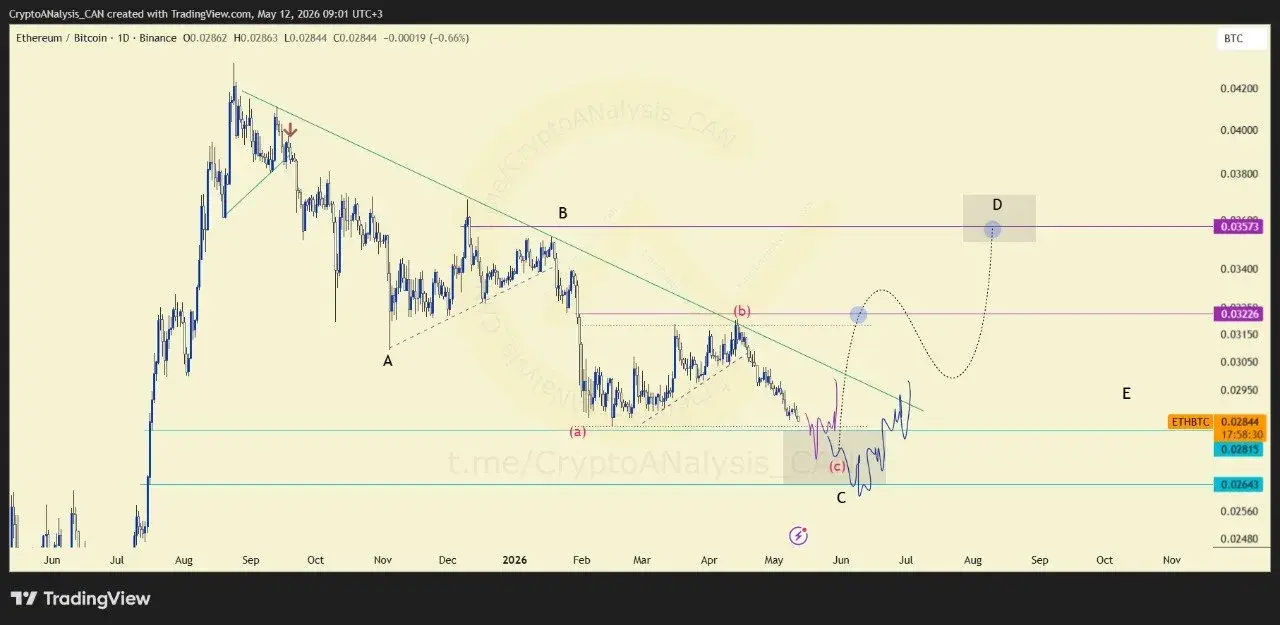
According to the daily chart, the final corrective wave within the broader ABC structures appears close to completion. The highlighted zone is being monitored as a potential area where ETH could begin regaining momentum against BTC.
🎯 Entry Decision
Rather than reacting to short-term market sentiment, traders may prefer to watch the highlighted region for confirmation. The zone can serve as a timing reference when evaluating spot exposure to Ethereum and other altcoins.
💰 Execution Plan
Patience remains essential while waiting for the corrective structure to finish. Using technical confirmation instead of emotional decision-making can improve trade timing and risk control.
📈 Outlook
If the current correction completes as expected, ETHBTC could begin showing relative strength, potentially improving conditions for Ethereum and selected altcoins.
