⚡️ Market / Price Context
Many traders have questioned why Ethereum has underperformed relative to several recovering cryptocurrencies. Ethereum Dominance (ETH.D) provides an important perspective, as it measures Ethereum's share of the total cryptocurrency market and often reflects broader capital allocation trends.
📈 Chart Explanation
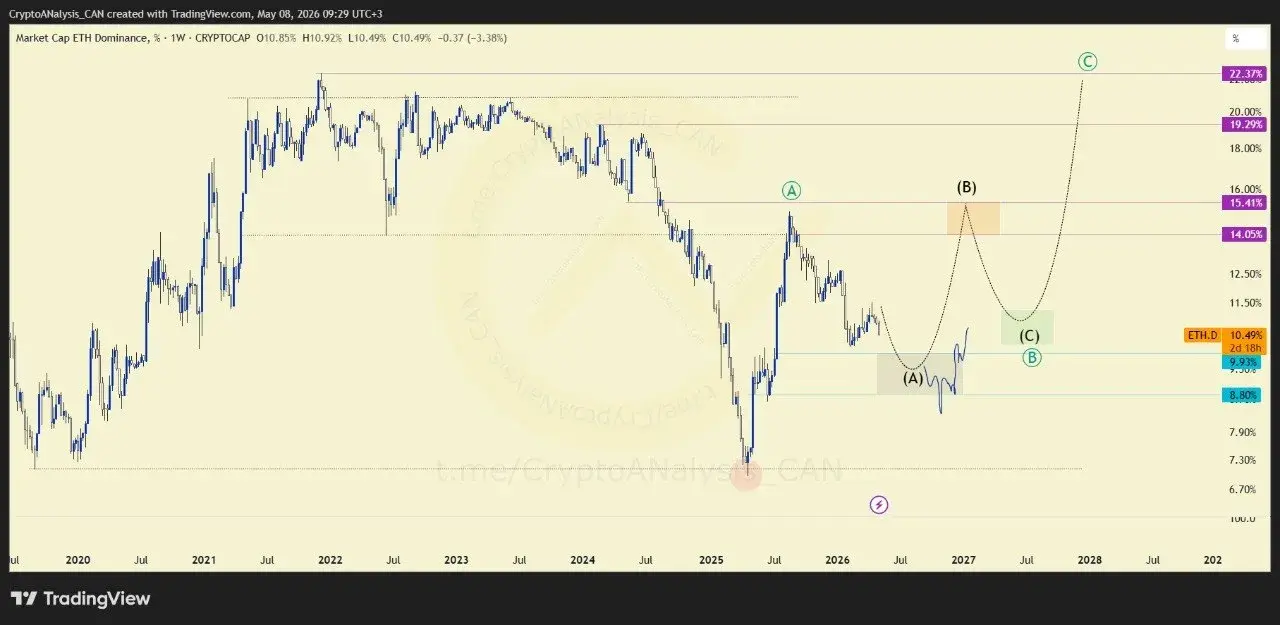
The weekly chart highlights a larger market structure that began with a strong advance during mid-2025. That rally is identified as wave A of a broader pattern. Since then, Ethereum Dominance has been developing an internal ABC corrective structure, producing alternating periods of strength and weakness rather than a sustained trend.
This ongoing correction may explain why Ethereum has not matched the recovery pace seen in some other digital assets.
🎯 Entry Decision
The primary focus is the highlighted support zone, which represents the area where the next significant bullish phase could emerge. Traders may prefer to wait for confirmation around this region rather than anticipating a reversal prematurely.
💰 Execution Plan
Monitoring reactions within the highlighted zone remains key. Any signs of stabilization or renewed momentum could provide valuable insight into whether the corrective structure is approaching completion.
📈 Outlook
If the highlighted support area successfully holds, Ethereum Dominance could begin a new bullish leg. Such a development may support a broader recovery in Ethereum and potentially improve conditions across the altcoin market.
📲 For more high-probability crypto setups, advanced chart breakdowns, and real-time market updates, join our Telegram community and stay ahead of the next major move in the market. 🚀