⚡️ Market / Price Context
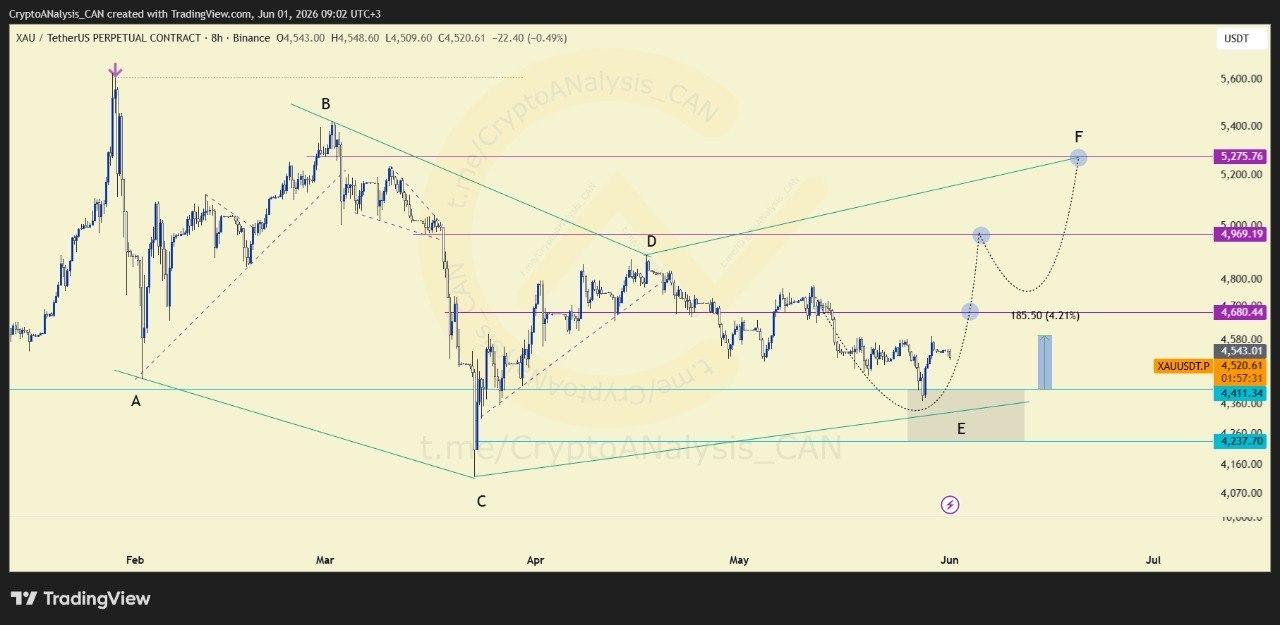
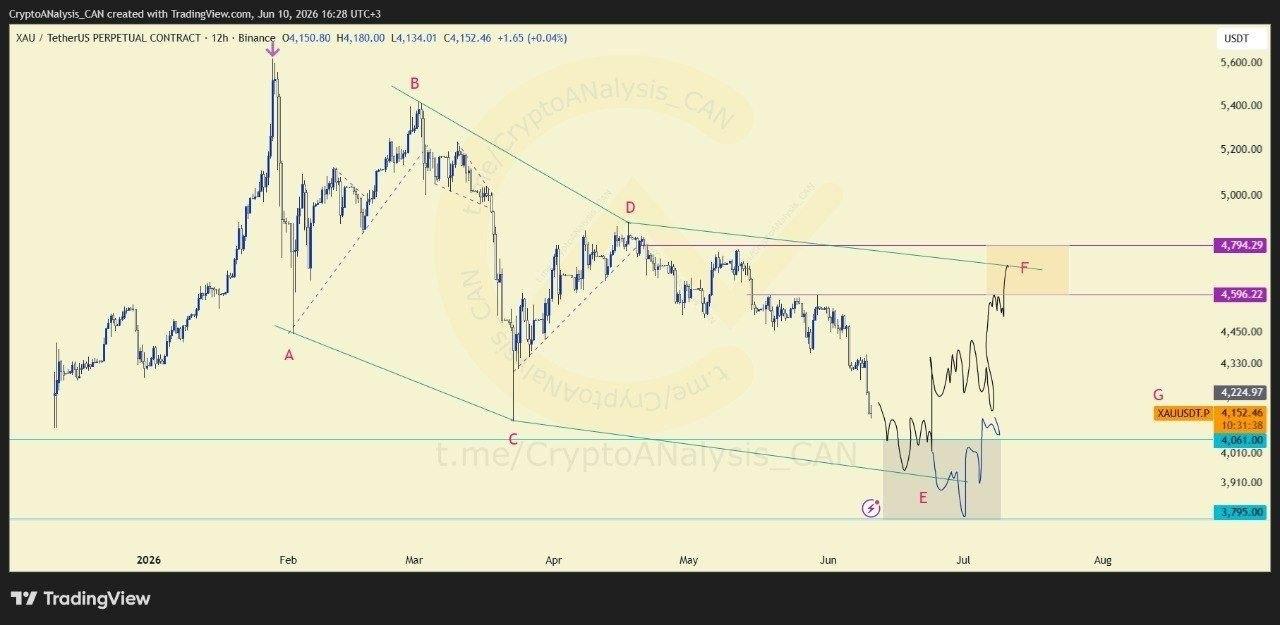
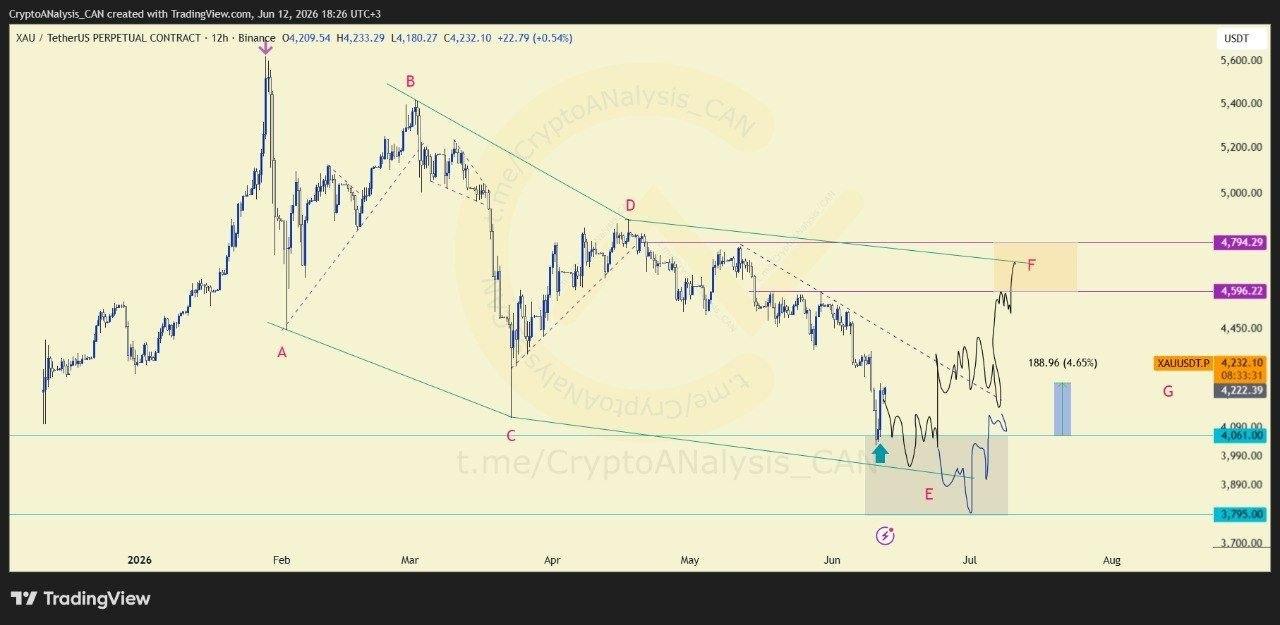
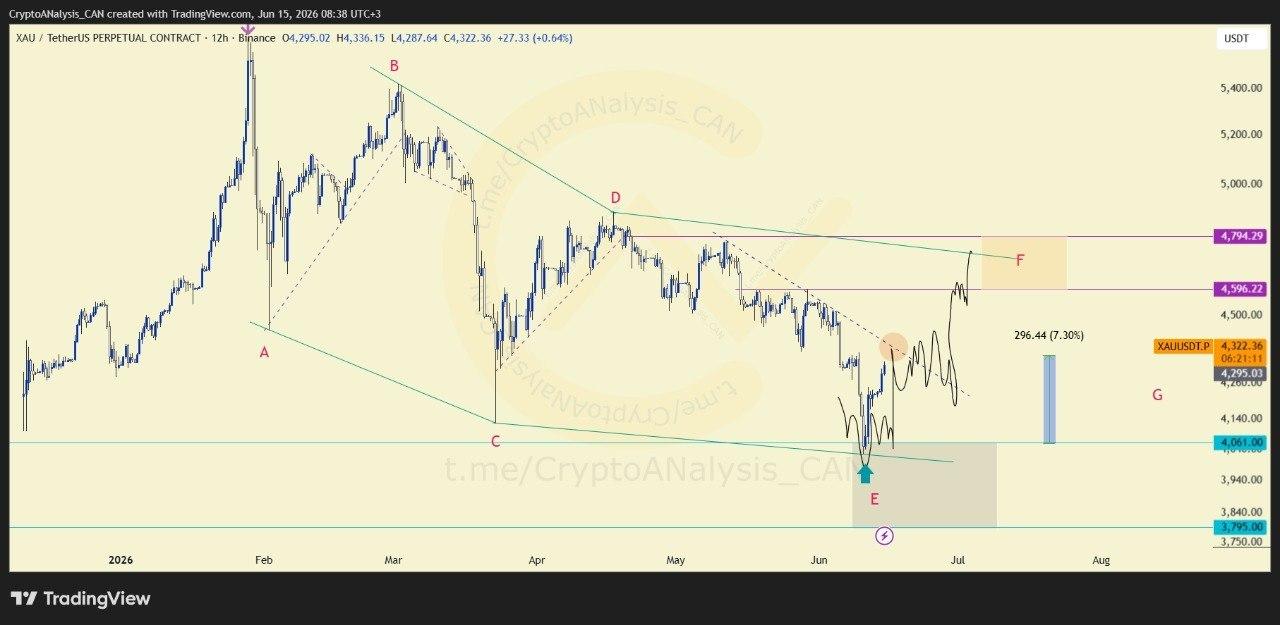
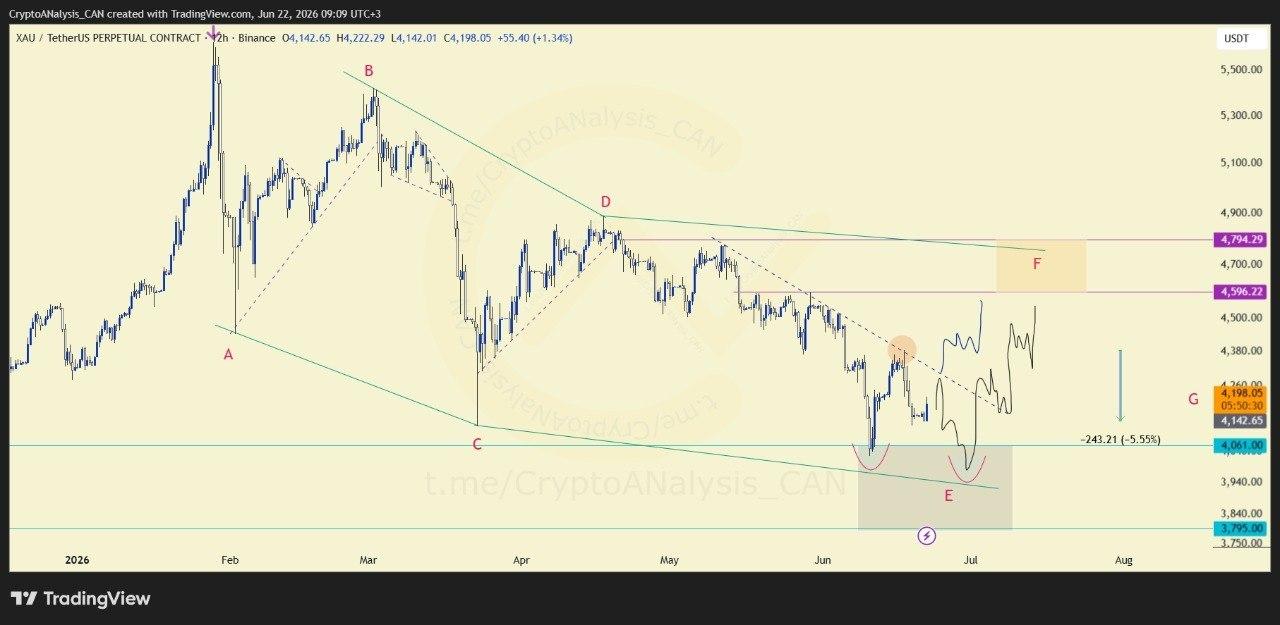
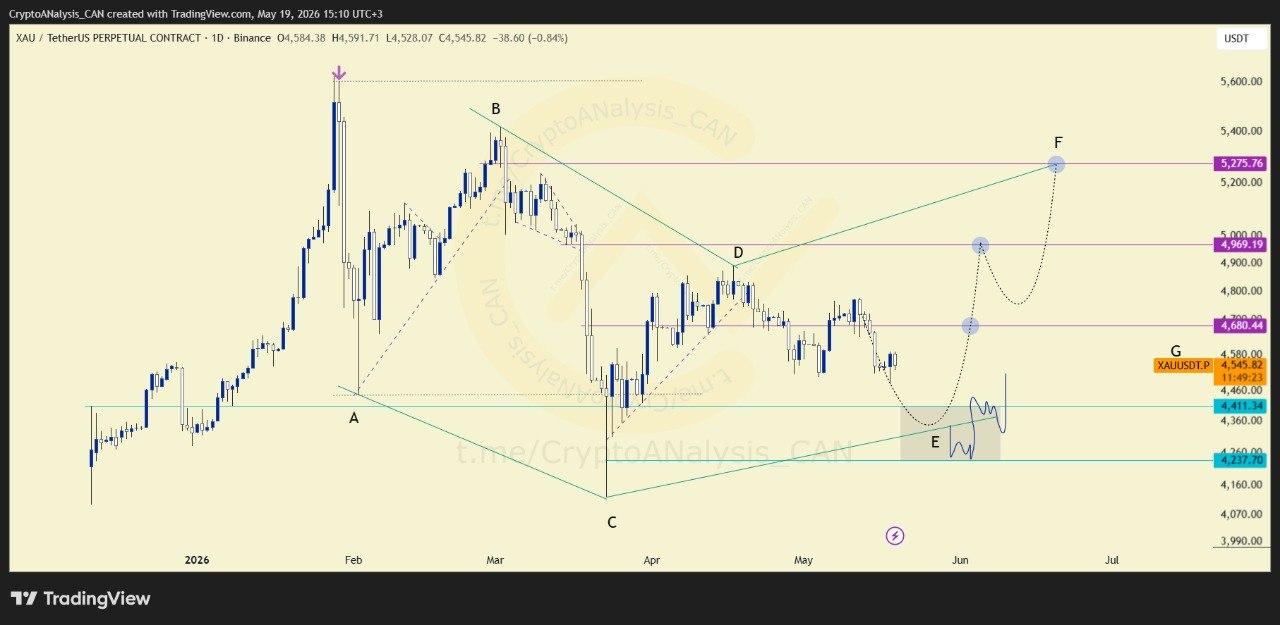
Gold's recent price action can be interpreted through the lens of a diametric pattern that may have begun following the sharp rejection seen in February. Under this view, the market is progressing through a series of structured legs rather than a straightforward trend.
📈 Chart Explanation
The current focus is on wave (E), where price appears to be trading within the pattern. Diametric formations are known for their alternating swings, and identifying the completion of each leg is often critical for planning the next move.
📈 Outlook
If the current interpretation remains valid, attention will shift toward identifying the completion of wave (E) and the potential for a subsequent upward leg. Until then, risk management remains the key priority.