⚡️ Market / Price Context
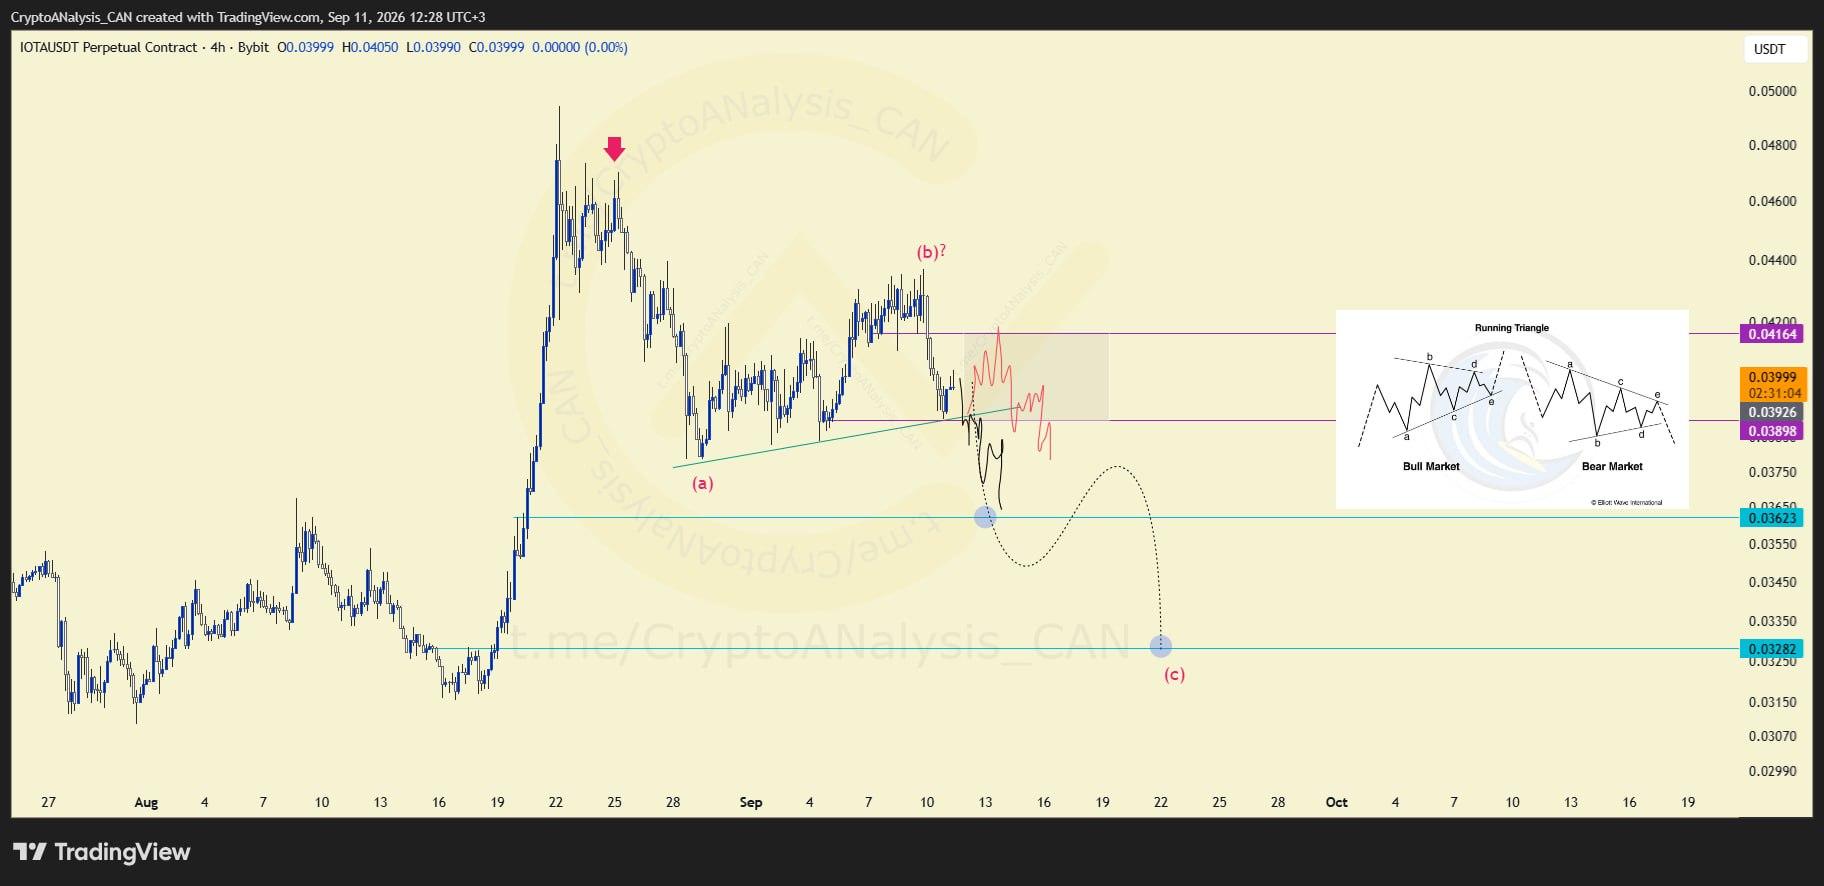
IOTA is currently developing price action consistent with a running triangle consolidation pattern. In classical Elliott Wave theory, running triangles represent complex corrective periods where the market builds directional tension before transitioning into the next structural phase. The central analytical question revolves around whether the intermediate Wave (b) sequence has formally concluded or remains active.
📈 Chart Explanation
Within a running triangle framework, a primary ascending trendline provides the structural boundary for the consolidation. Technical evaluation relies on two conditional scenarios regarding Wave (b):
- Scenario A (Wave b Completed): A clear breakdown below the defining trendline confirms the completion of the corrective leg, setting up the initiation of Wave (c) toward the lower support zone.
- Scenario B (Wave b Incomplete): If the trendline holds firm, the structure signals that Wave (b) requires further development, allowing price action to test the secondary resistance zone prior to any broader decline.
📈 Outlook
The immediate market trajectory depends directly on price behavior at the primary trendline boundary. Analysts monitor whether the boundary sustains buying interest to validate the upper resistance test, or yields to downward momentum to confirm the completion of Wave (b) and activate Wave (c) toward baseline support.
