⚡️ Market / Price Context
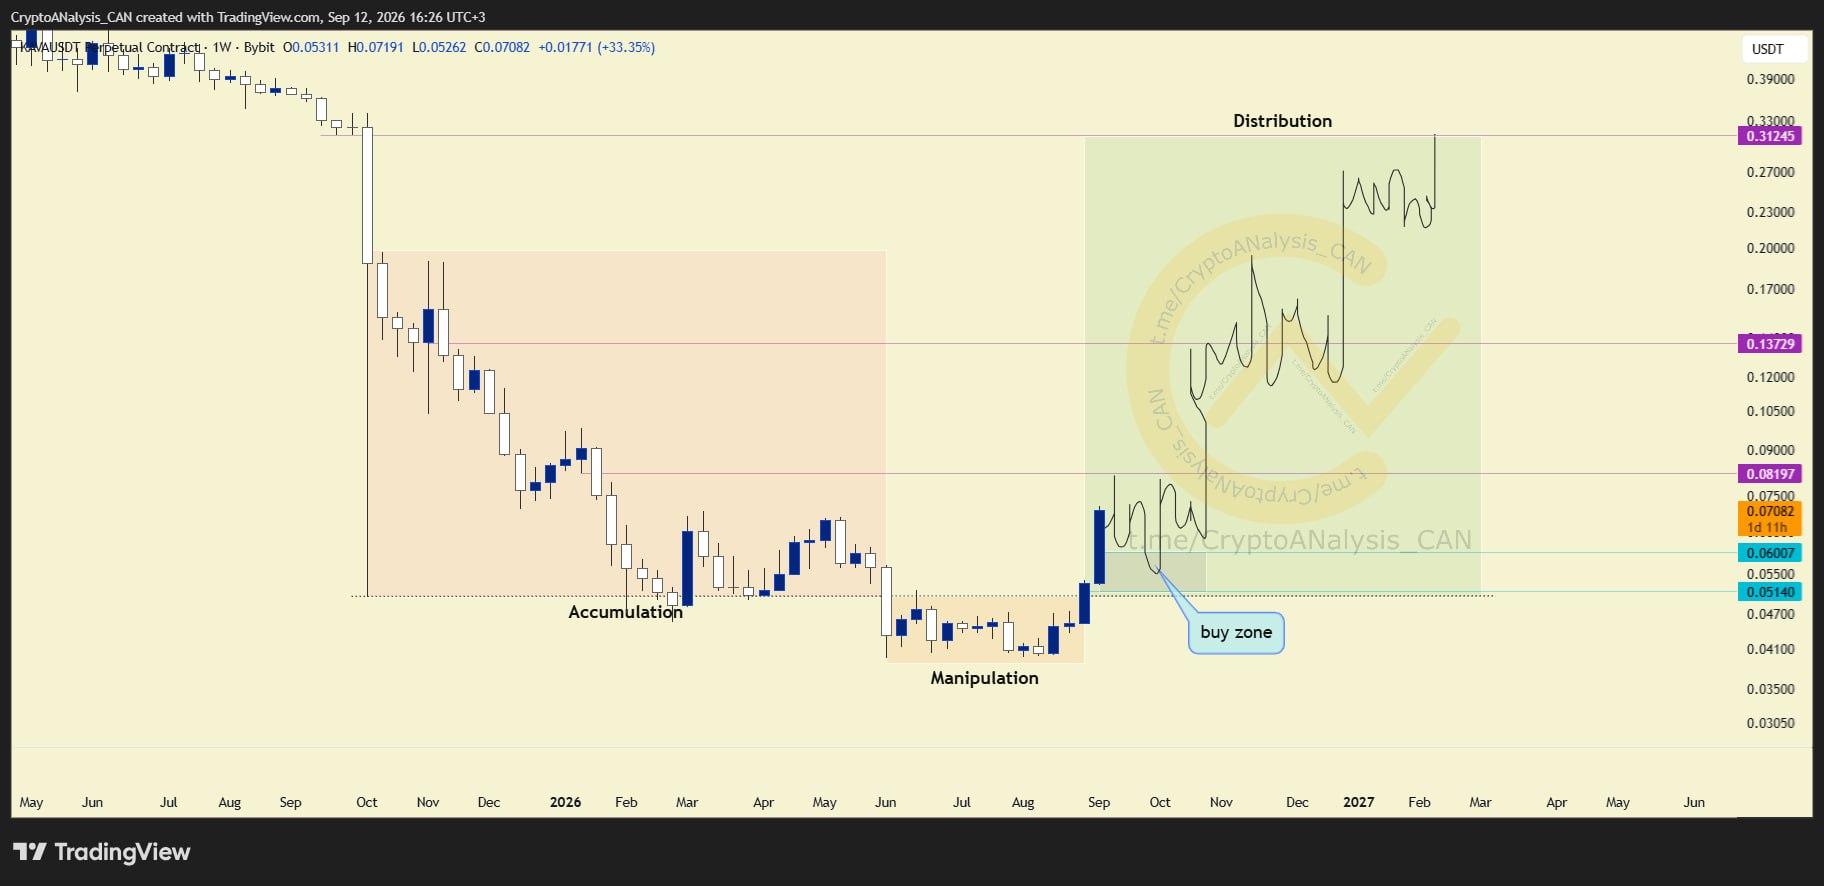
KAVA is exhibiting a multi-stage market structure characteristic of an Accumulation-Manipulation-Distribution (AMD) pattern on higher timeframes. After undergoing extended cyclical development, the macro structure indicates that the asset is positioning to enter its distribution phase, where market participants observe transitions in broader trend dynamics.
📈 Chart Explanation
From a technical charting standpoint, higher-timeframe AMD formations illustrate three distinct market phases: early accumulation, structural liquidity expansion, and subsequent distribution. In this setup, technical structure highlights a reliable support-turned-resistance zone. A measured pullback to this highlighted level demonstrates how price systematically tests structural balance points before confirming the continuation of the final cycle leg.
📈 Outlook
The technical path forward hinges on how price interacts with the highlighted zone. Classical market theory indicates that a successful retest of this reliable level can provide analytical confirmation for the distribution phase to unfold fully, establishing a defined framework for assessing macro continuation.
