⚡️ Market / Price Context
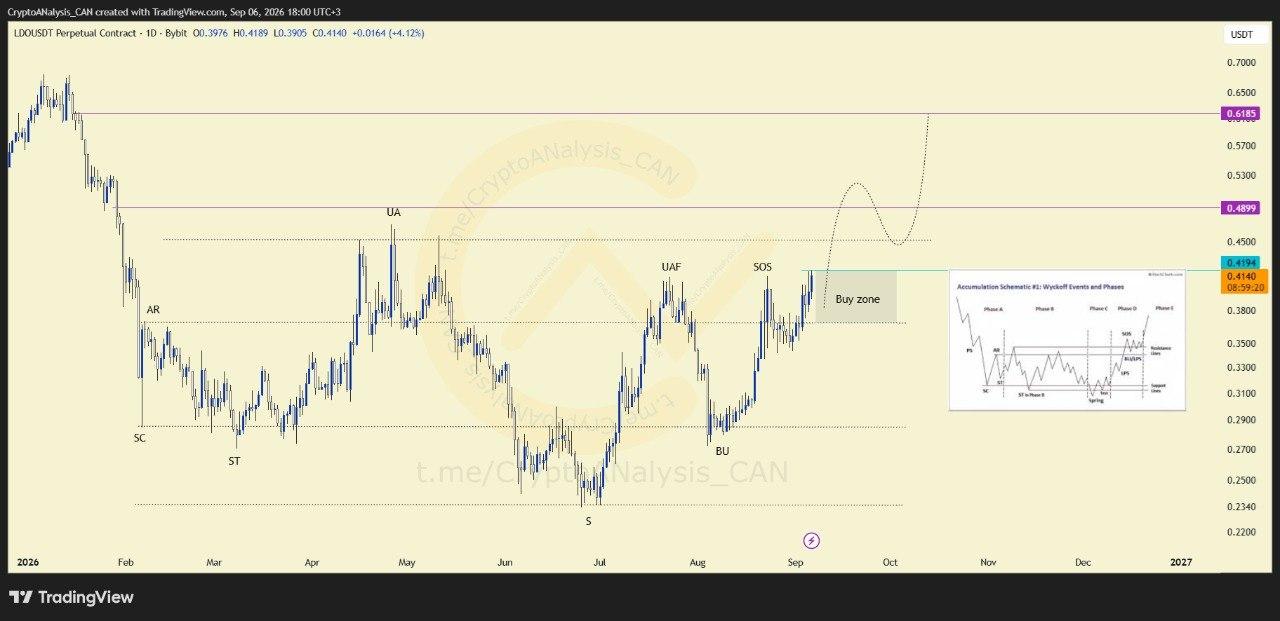
LDO is approaching the final stage of a Wyckoff structure on the daily timeframe. Signs of Strength (SOS) are forming, indicating the underlying pressure within the pattern is shifting toward the bullish side as the structure nears resolution.
📈 Chart Explanation
The setup hinges on a breakout above a defined blue resistance zone, which would confirm the SOS phase and activate the bullish structure. Once triggered, the pattern points to two distinct upside targets, reflecting the typical projection method used in Wyckoff analysis following a confirmed breakout. On the downside, a gray support zone serves as the structural boundary, a break below this level would invalidate the bullish setup entirely.
📈 Outlook
With the pattern maturing, the breakout above resistance is the key trigger to watch. A confirmed move higher would open the path toward the two projected targets, while holding above the gray support remains essential for the bullish structure to stay valid.
