⚡️ Market / Price Context
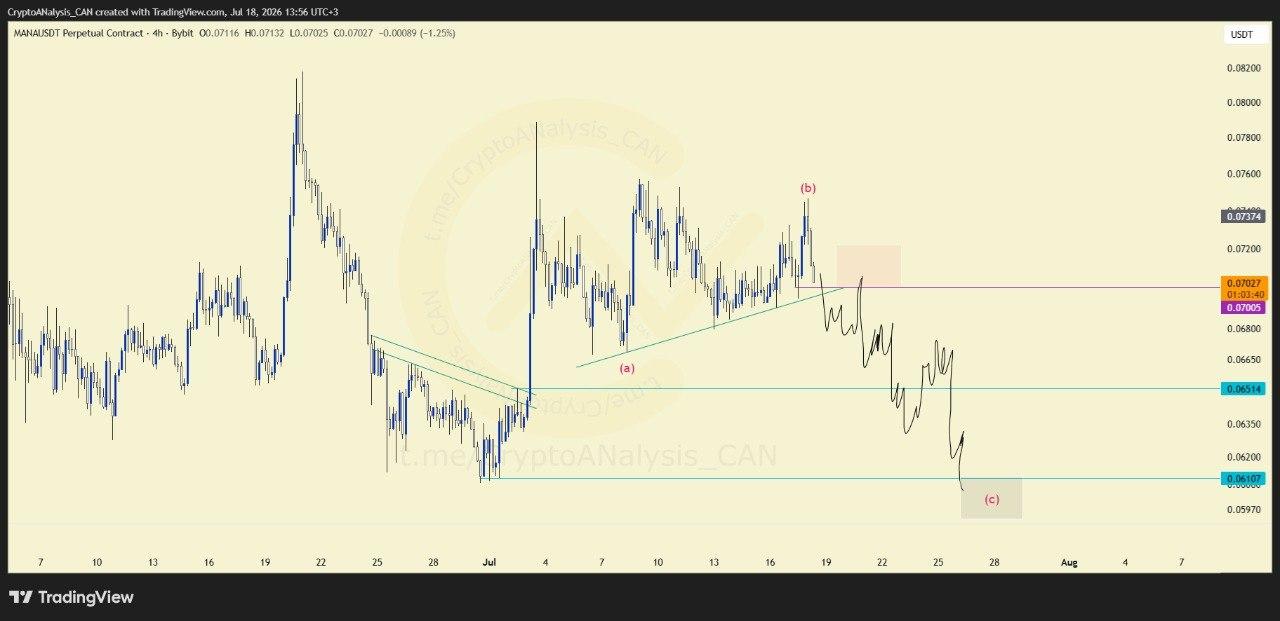
MANA saw a strong pump in early July before sellers stepped in with an intermission phase, labeled leg (a). Since then, buyers and sellers have been contesting a supportive trendline that formed as the market worked through this corrective structure on the 4H chart.
📈 Chart Explanation
Sellers are currently attempting to breach below this supportive trendline, a move that would mark the start of a new corrective leg (c). The battle at this trendline is significant because it represents the boundary between the current consolidation, leg (b), and the next phase of the pattern.
📈 Outlook
The most critical signal to watch is a loss of the highlighted support zone. Confirmation that sellers have taken control below this level would mark the completion of leg (b) and the beginning of leg (c), offering a potential opportunity to join the final leg of this corrective pattern with proper risk management applied.
