⚡️ Market / Price Context
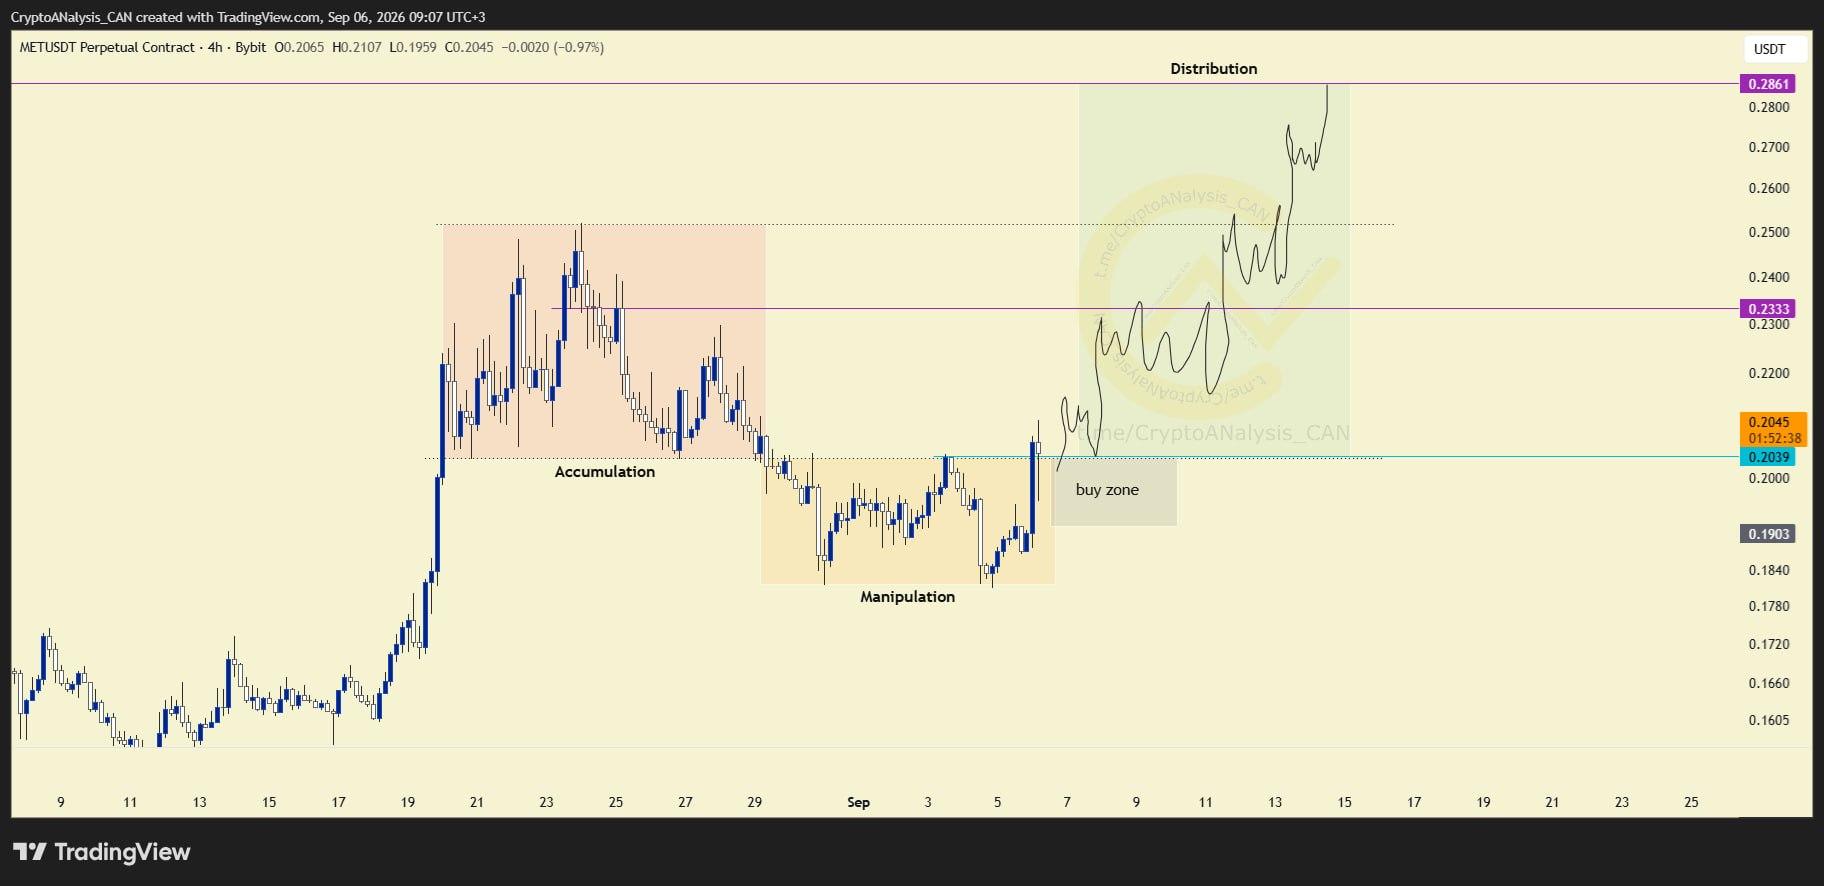
MET is forming another instance of the AMD (Accumulation–Manipulation–Distribution) pattern on the 4-hour chart. This recurring structure reflects a cyclical approach to price behavior, where each phase sets up conditions for the next.
📈 Chart Explanation
A strong recent candle suggests the manipulation phase, typically marked by a deceptive move designed to trap traders on the wrong side has concluded. This shift indicates price may now be transitioning into the distribution phase, where the market begins its next directional expansion following the manipulation sweep.
📈 Outlook
For this scenario to remain valid, the highlighted gray support zone needs to hold. This level acts as the structural confirmation that the manipulation phase has truly ended. A break below it would undermine the thesis, so risk should be planned with this zone as the key reference point.
