⚡️ Market / Price Context
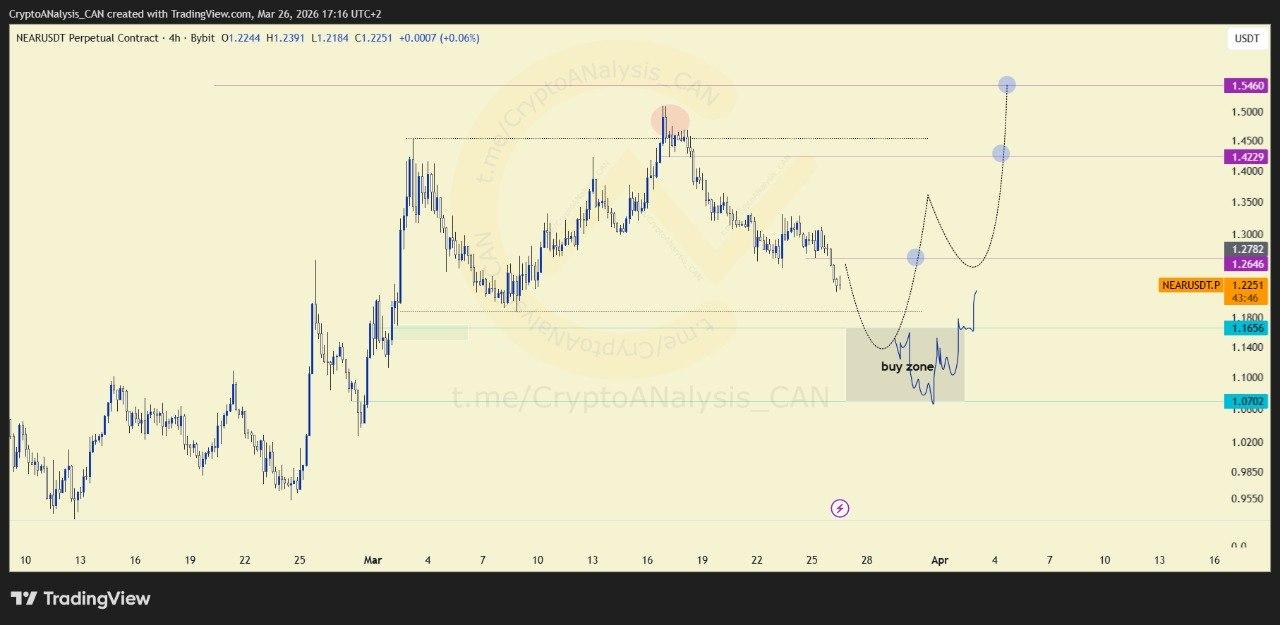
NEARUSDT is currently moving lower within a corrective structure, bringing price closer to a predefined buy zone. This area is attracting attention as traders evaluate whether the correction is nearing completion.
📈 Chart Explanation
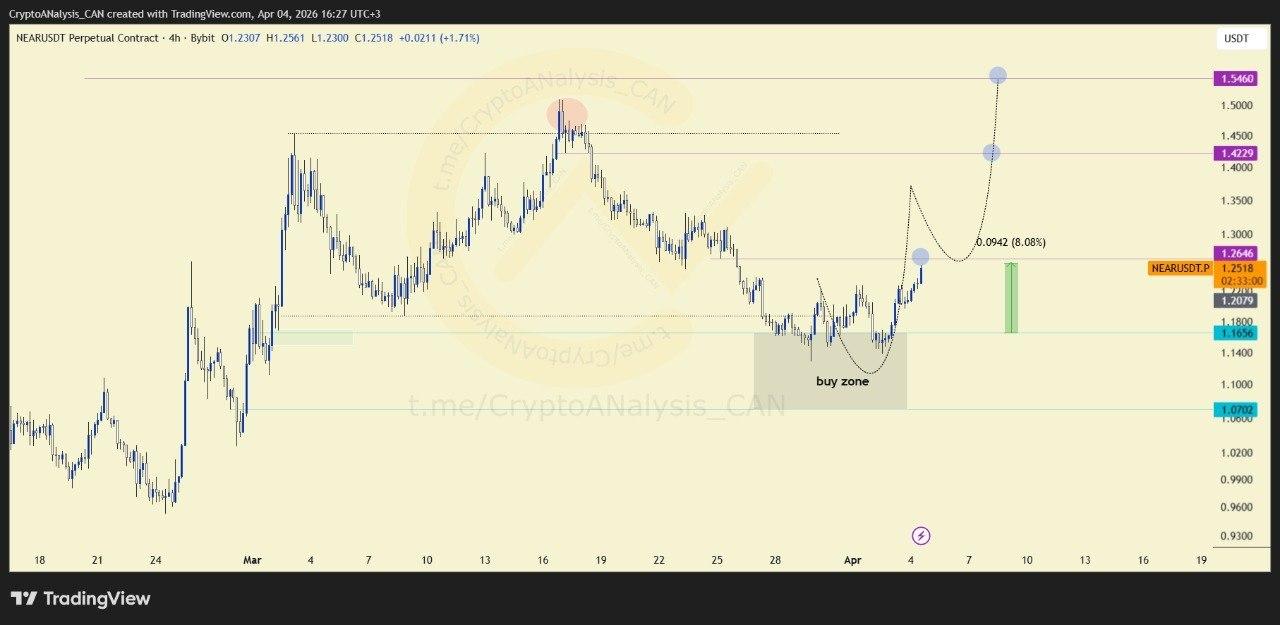
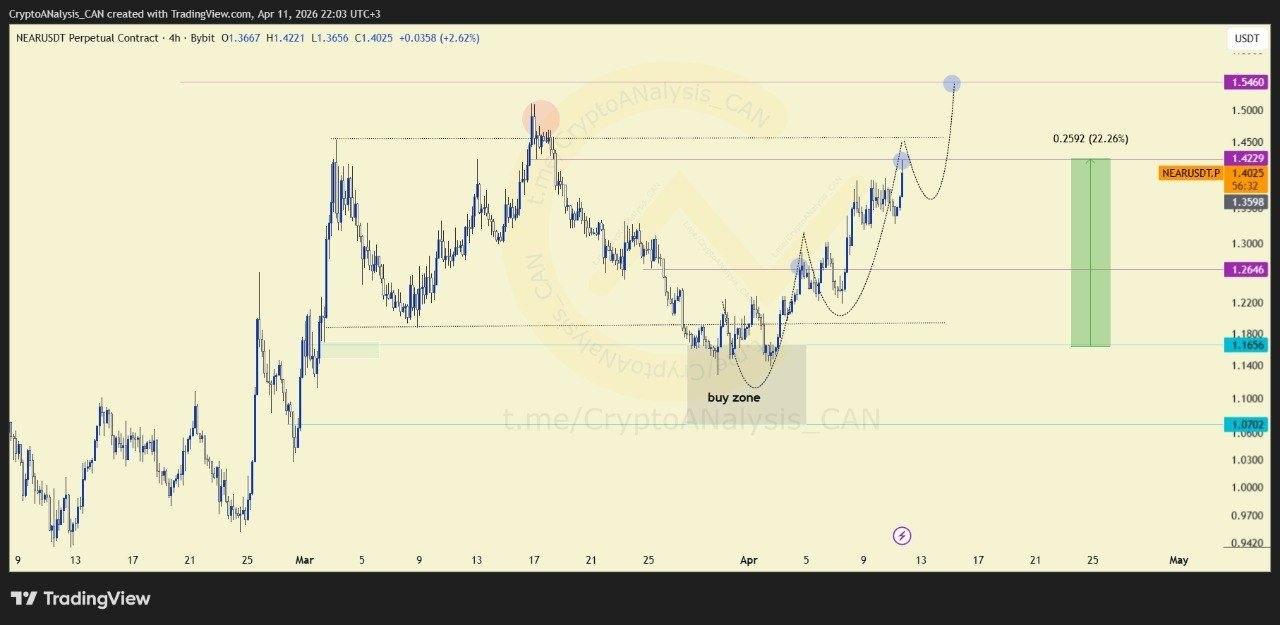
The 4-hour chart highlights a scenario where price is approaching a key technical support area. The roadmap anticipates a liquidity sweep followed by a reaction from the buy zone. A successful response could provide the foundation for a move toward the resistance levels marked on the chart.
📈 Outlook
The corrective move remains the primary focus until price reaches the highlighted zone. A strong reaction from support would improve the probability of a recovery toward resistance, while failure to respond would delay the bullish continuation scenario.