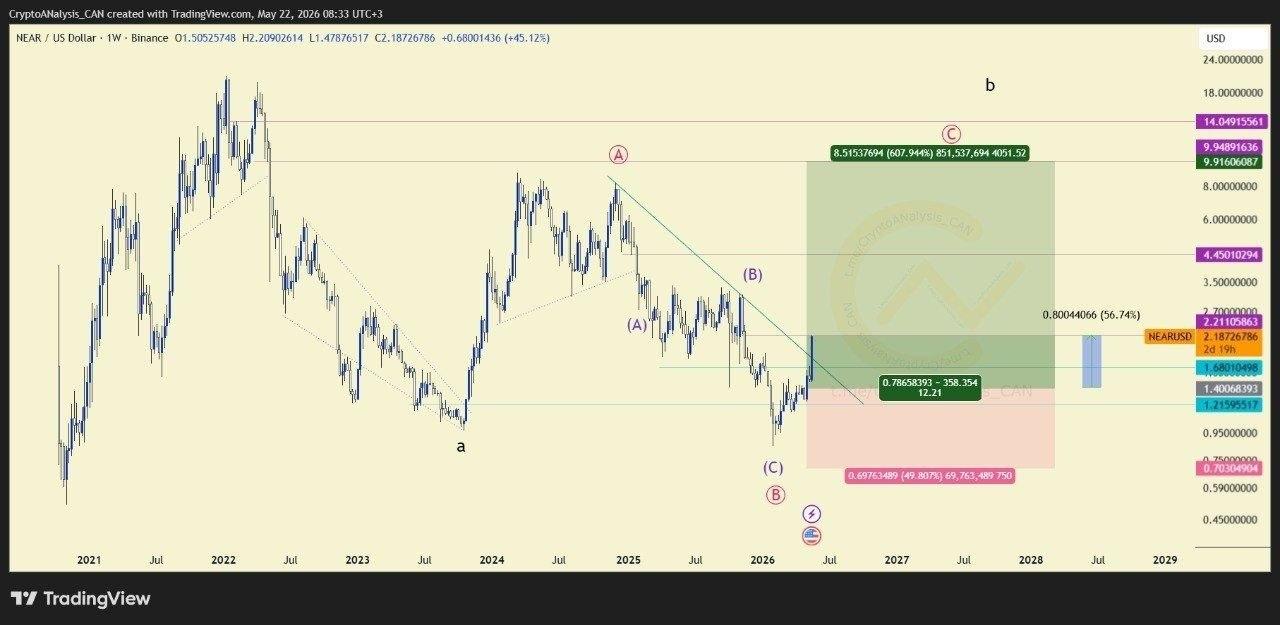
NEAR has returned to a region we're watching after a strong move from our previous setup. 📈 With price revisiting a higher-timeframe support zone, we're mapping out a new long scenario on the weekly chart.
⏰ Timeframe: 1W
📈 Direction: Long
💡 Entry Area: 1.680 – 1.215
🎯 TP1: 2.704
🎯 TP2: 4.450
🎯 TP3: 9.948
🛑 SL: 0.703
After a successful move from our earlier NEAR position, we're seeing price retrace back into a potential accumulation area. Our focus is on how price behaves within this range and whether longer-term bullish structure can re-establish itself from here.
This reflects our own trading activity and is shared for informational purposes only; not financial advice.
What crypto charts are you tracking on the weekly timeframe?