⚡️ Market Context
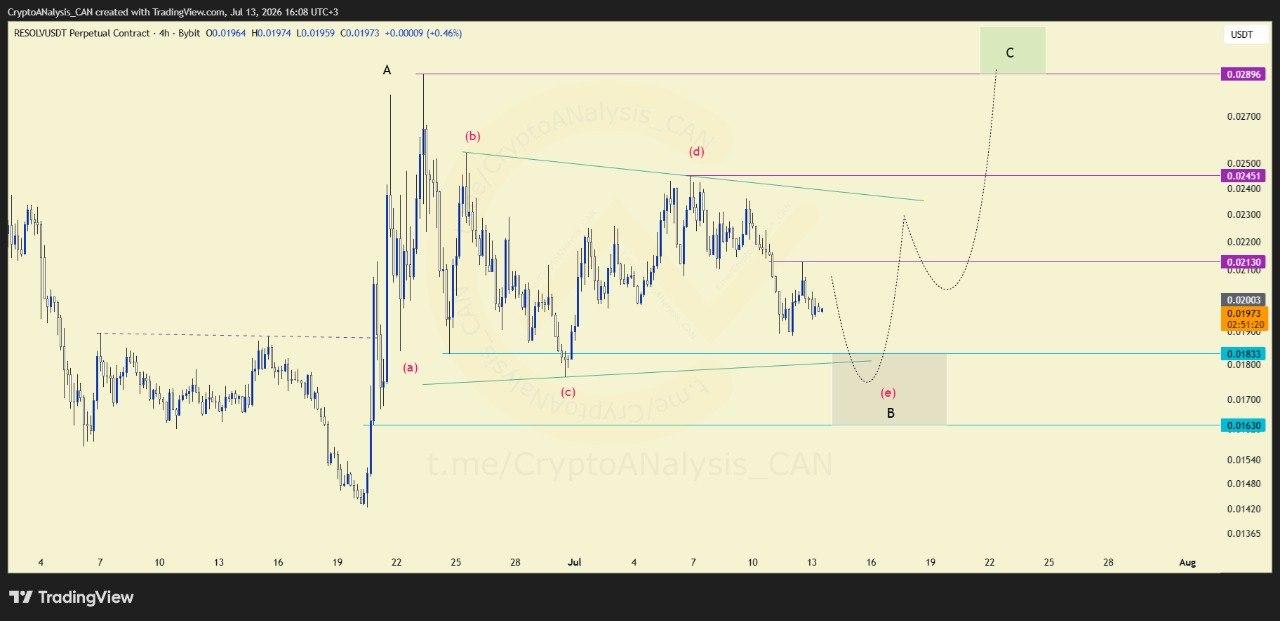
RESOLVE appears to be finishing the inner correction leg B of a broader ABC pattern, with the structure taking the form of a possible triangle.
📈 Chart Explanation
Triangle corrections typically resolve with a decisive breakout, and this structure is no different. The highlighted gray zone is the technical area where leg B is expected to complete, setting the stage for the triangle to release into a strong bullish move as wave C begins.
📈 Outlook
For wave (c) to begin as outlined, the support zone underpinning this structure needs to hold. If price instead penetrates well below the highlighted zone, the current corrective count would need to be revisited, as that would suggest the triangle thesis no longer applies.
