⚡️ Market / Price Context
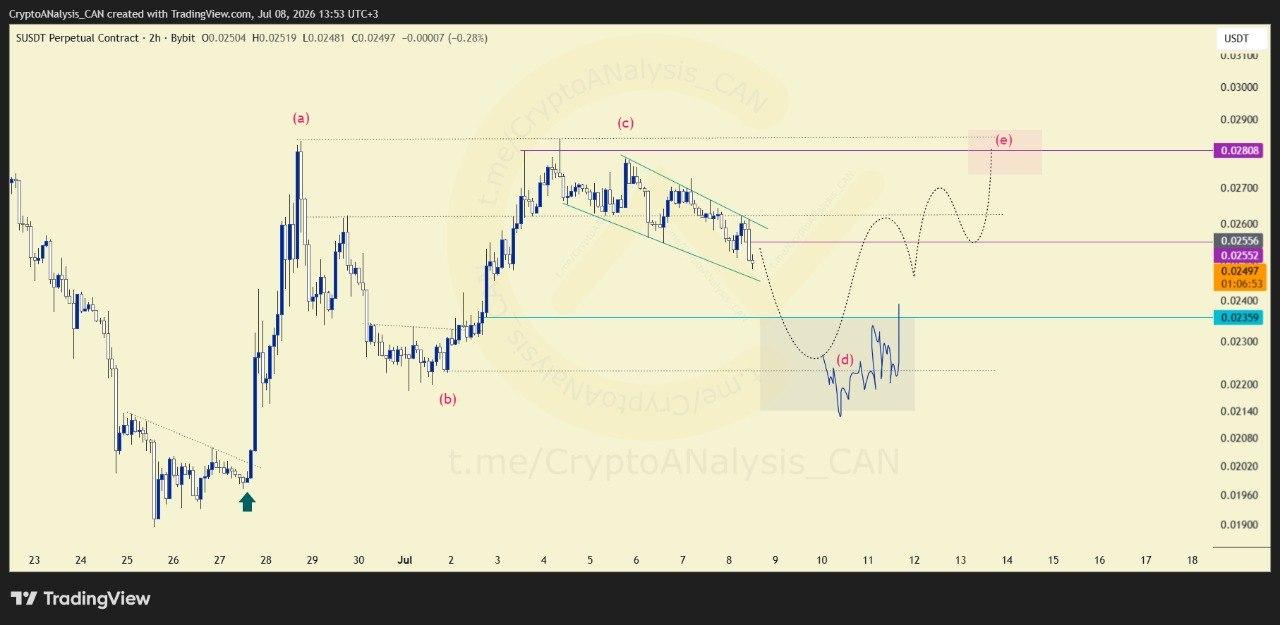
The current market structure suggests that Wave C may have reached completion, shifting attention to the possible beginning of Wave D. This transition indicates that the corrective structure is still developing, with price approaching an important technical area.
📈 Chart Explanation
The highlighted zone coincides with a major demand area, making it a critical level within the current Elliott Wave structure. A constructive reaction from this zone would support the view that the market is preparing for the next phase of the pattern.
📈 Outlook
The next move depends on how price responds at the highlighted demand zone. A strong reaction could mark the beginning of Wave E, while continued weakness would require a reassessment of the current wave structure.
