⚡️ Market / Price Context
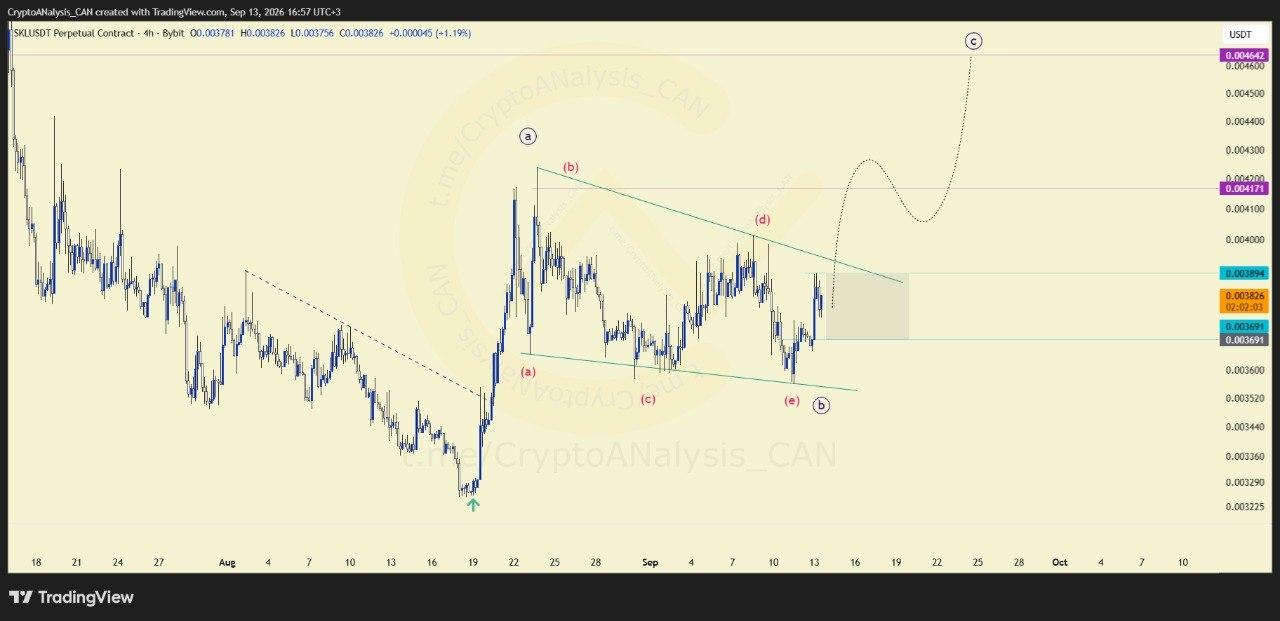
SKL is demonstrating an expanding market move framed within a broader ABC corrective sequence. Rather than moving in a single directional impulse, the asset's intermediate cycle reflects a phased progression, with the market building structural momentum through an internal consolidation phase.
📈 Chart Explanation
A technical breakdown of the intermediate structure indicates that Wave (B) has evolved into an inner triangle pattern. In classical technical theory, internal triangles represent localized volatility compression where price contracts between converging boundaries. The completion of this triangle is validated when price achieves a clear breakout above the highlighted resistance threshold.
📈 Outlook
A sustained break above the highlighted resistance confirms that the Wave (B) consolidation has concluded. From an educational perspective, following such structural shifts, price action frequently produces pullbacks toward the broken boundary to test it as new support, offering analytical confirmation for the next advancing wave phase.
