⚡️ Market / Price Context
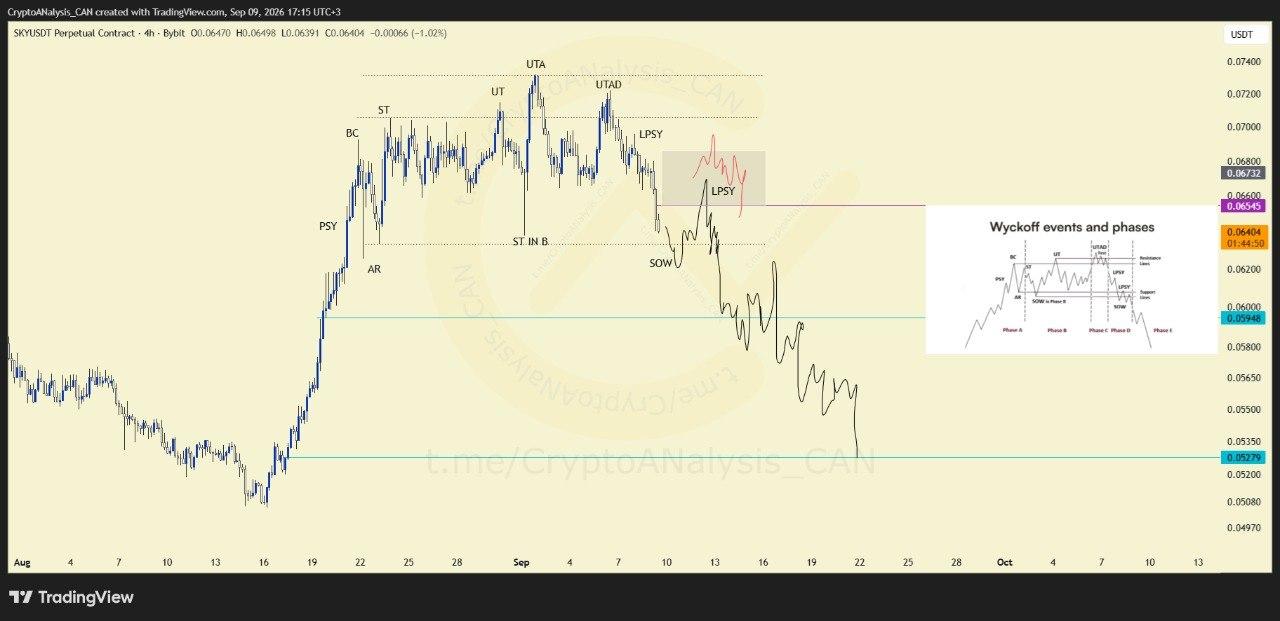
SKY is displaying early signs of a Wyckoff distribution structure on the 4-hour timeframe, with selling pressure gradually building. This pattern often emerges after an extended advance, suggesting the market may be transitioning from accumulation-driven strength into a phase of controlled distribution by larger participants.
📈 Chart Explanation
The current structure points to a possible liquidity grab beneath prior swing lows, a move that would align with a Sign of Weakness (SOW) in classic Wyckoff terms. This kind of sweep typically clears out resting stop-losses before price reacts. Following such a move, any retracement back into the Last Point of Supply (LPSY) zone becomes a key technical area to monitor, as it often marks where selling interest re-enters the market.
📈 Outlook
If the distribution thesis plays out, a break below recent lows followed by a bounce into the LPSY zone would confirm the structure and increase the probability of continued downside pressure. Traders should watch price behavior around this zone closely, as it may define SKY's next directional move.
