⚡️ Market / Price Context
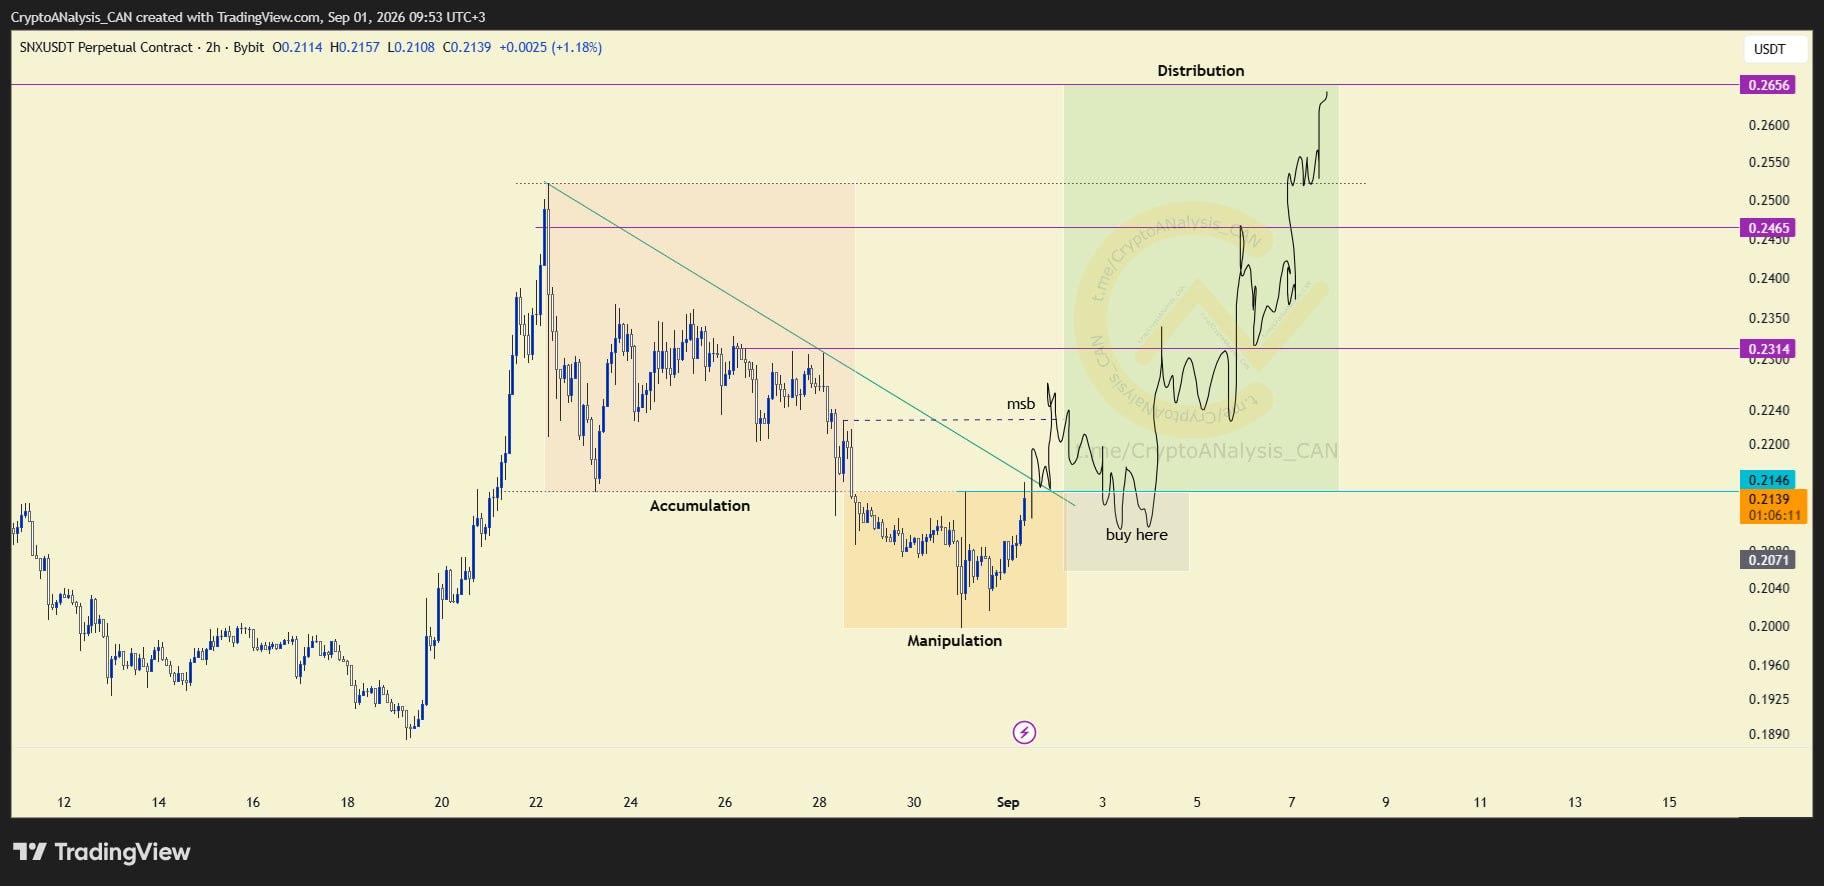
SNX is developing another AMD (Accumulation, Manipulation & Distribution) pattern on the 2-hour chart, with the manipulation phase nearing its conclusion. This cyclical structure suggests price is approaching a transitional point toward the next phase of the sequence.
📈 Chart Explanation
Price is currently capped by a strong resistance confluence, the manipulation zone overlapping with a descending trendline. This combination has kept price suppressed, and a clean breakout through this zone is required before the distribution phase can be considered active. Critically, this breakout needs to be confirmed by a Market Structure Break (MSB), which signals that the manipulation phase has genuinely concluded.
📈 Outlook
Once MSB confirms the shift, a pullback into the broken zone would mark the transition into distribution, offering a more structurally sound area of interest. Acting before this confirmation increases the risk of re-entering manipulation, so patience through the breakout remains the priority.
