← Back to Analysis

πŸ’° SOL Price Analysis: 3-Day ABC Pattern Signals Potential Pullback Opportunity

07/03/2026 14:03

⚑️ Market / Price Context

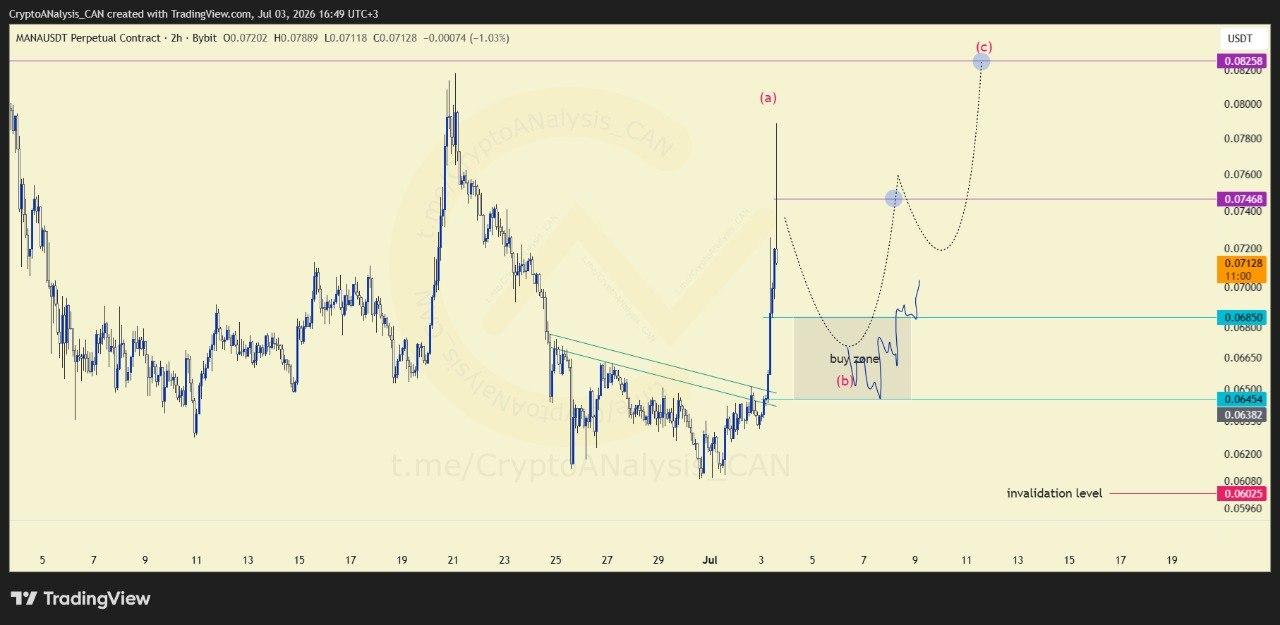
SOL has produced strong impulsive candles, indicating a shift in momentum that may be forming the early stages of an ABC corrective pattern. Rather than extending immediately, the market appears to be preparing for a temporary retracement.

πŸ“ˆ Chart Explanation

The current structure points to the development of Wave (b) following the initial upward move. This corrective phase could provide a healthier market structure before a potential continuation into Wave (c).

🎯 Entry Decision

Instead of chasing the recent move, the preferred approach is to wait for a potential Wave (b) pullback. Monitoring price action around the anticipated retracement area may offer a more favorable entry if the corrective structure develops as expected.

πŸ’° Execution Plan

The strategy focuses on identifying high-quality entry points during the expected pullback while maintaining disciplined risk management. Waiting for confirmation before entering helps reduce exposure if the correction extends further than anticipated.

πŸ“ˆ Outlook

The emerging ABC structure remains constructive as long as the expected correction develops in an orderly manner. A completed Wave (b) could create the foundation for the next bullish leg if momentum returns.

Get Full Access to All Our Content for Free!
You can find our other outlets at the bottom of the website.
Telegram