← Back to Analysis

🌞 SOLUSDT Weekly Structure Approaches Critical Decision Zone πŸš€

05/11/2026 09:56

⚑️ Market / Price Context

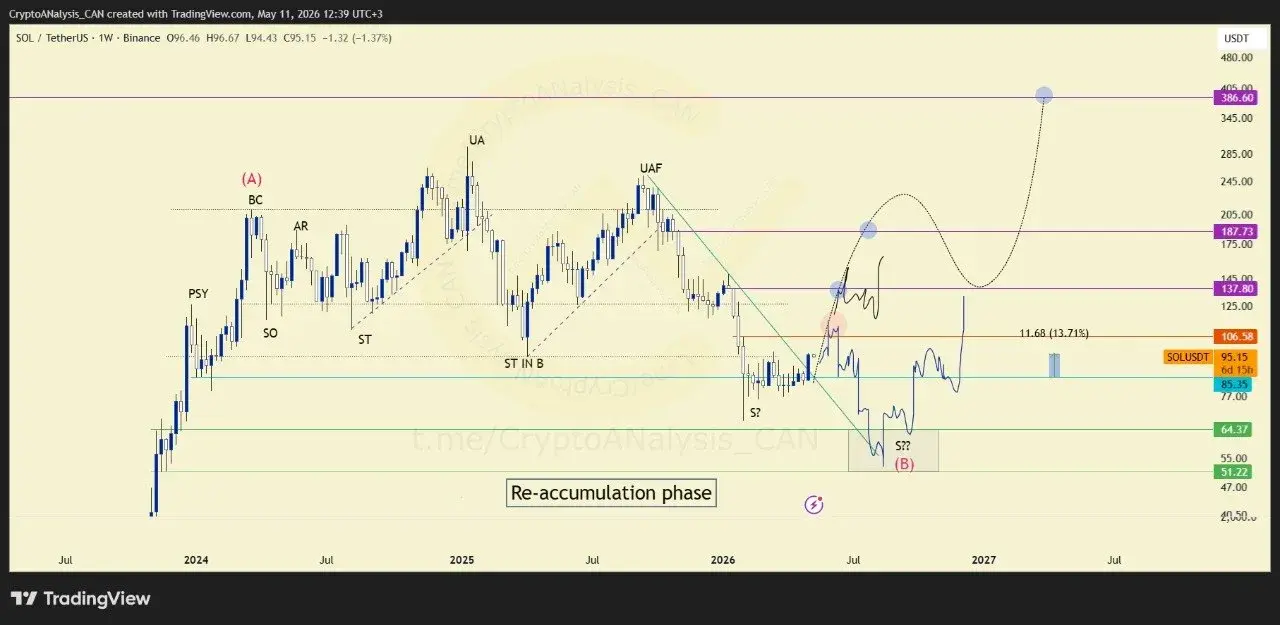
SOL has demonstrated resilience after holding a significant support level that contained price for an extended period. The recent bullish candle confirms a strong reaction from this zone and signals renewed momentum within the broader market structure.

πŸ“ˆ Chart Explanation

The highlighted support area successfully prevented further downside and triggered a meaningful recovery. As a result, price is now advancing toward a key target region near the highlighted take-profit area, where market maker activity and liquidity reactions may become increasingly important.

🎯 Entry Decision

The current focus is not on predicting direction but on observing how price behaves around the target zone. A constructive reaction could support continued upside momentum, while signs of rejection may indicate that additional accumulation is required before the next major advance.

πŸ’° Execution Plan

Traders should closely monitor price behavior near the target area and allow market confirmation to guide decision-making. Maintaining disciplined risk management remains essential as the market approaches a potentially influential level.

πŸ“ˆ Outlook

The reaction around the highlighted target zone is likely to determine the next phase for SOL. Sustained support could encourage further momentum toward higher objectives, while rejection may increase the probability of a move toward lower support areas to complete the projected Spring (S) leg.
πŸ“² Join our Telegram community for real-time crypto trade setups, professional market structure analysis, and early breakout opportunities before the next major move accelerates. ⚑

Updates

06/14/2026 10:02

πŸ“£ Trade Update

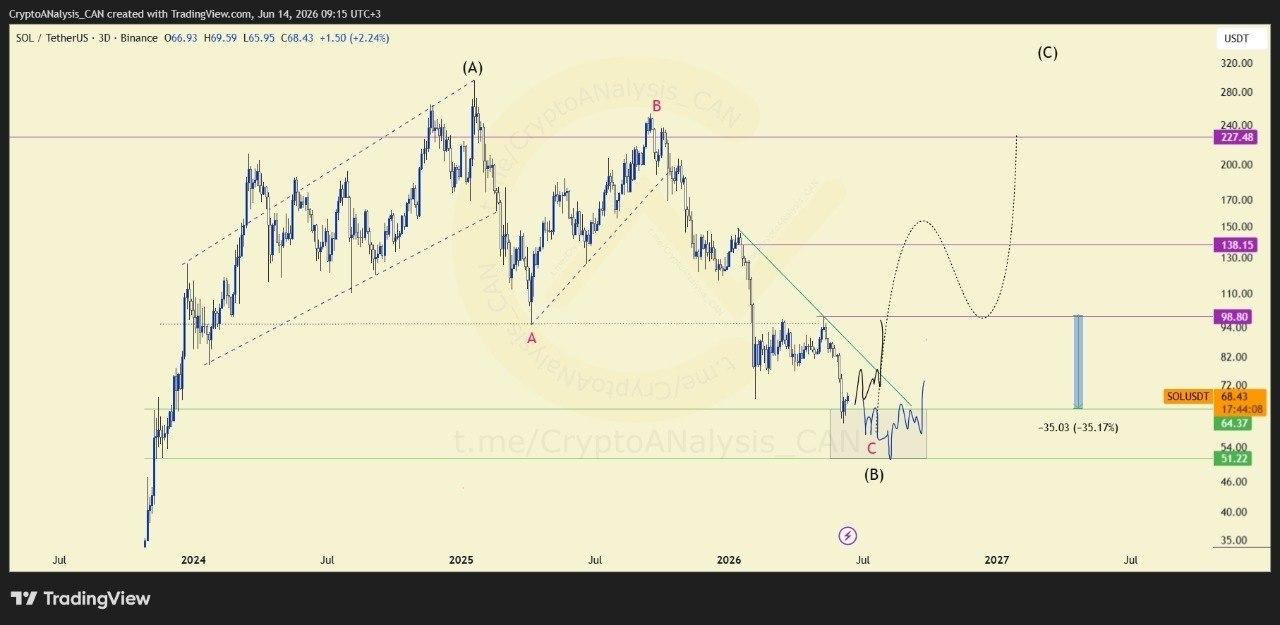
Solana followed the projected correction path as wave C pushed price lower into the anticipated buy zone. The broader structure continues developing exactly within the previously outlined roadmap.

🎯 Target Hit

The move has now delivered a 35.17% correction since the last update, successfully reaching the expected accumulation area and confirming the downside scenario.

πŸ’° Trade Management

Current focus shifts away from downside momentum and toward identifying the ending structure of larger wave (B). Price reaction inside the highlighted zone will determine whether recovery conditions begin forming.

πŸ“ˆ What’s Next

Recovery may begin from the upper part of the current zone, initially targeting the descending trendline before moving toward higher targets. A deeper pullback remains possible, with short-term momentum likely deciding the strength of the next move.

07/03/2026 10:13

πŸ“£ Trade Update

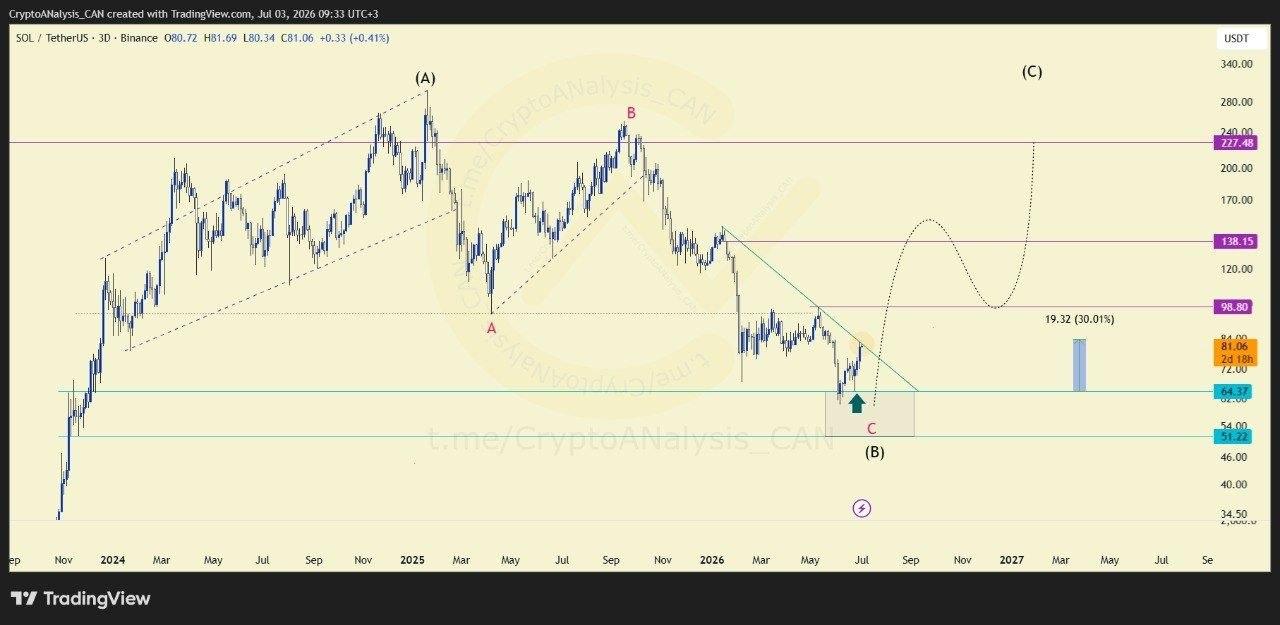
SOL has advanced nearly 30% from the previously identified demand zone, validating the bullish reaction from support. Price is now testing a key descending trendline that has acted as a major technical resistance on the 3-day timeframe.

🎯 Target Hit

The recovery from the highlighted demand zone has produced an approximate 30% gain, bringing price to the next significant technical barrier. This move confirms strong buying interest while shifting attention to the current resistance level.

πŸ’° Trade Management

The focus now is on monitoring price behavior around the descending trendline. A sustained move above this level would strengthen the bullish structure, while failure to break through may extend the consolidation phase.

πŸ“ˆ What’s Next

If buying momentum continues, a breakout above the trendline could support a move toward higher price levels. However, a rejection at resistance would postpone the breakout scenario and could lead to a pullback toward the highlighted demand zone, where the market structure can be reassessed.

07/14/2026 14:09

⚑️ Market Context

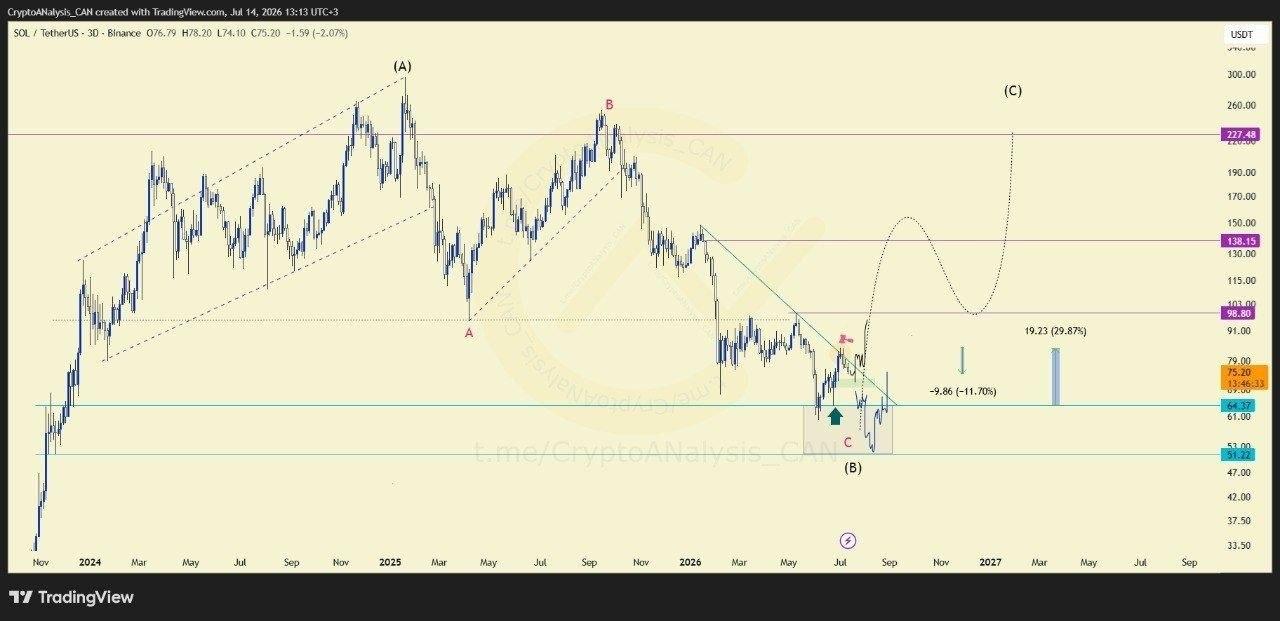
SOL rallied roughly 30% from support before running into a highlighted critical zone, which has now rejected price by more than 10% so far.

πŸ“ˆ Chart Explanation

The rejection at this zone puts the broader trendline structure to the test. Price is now working back down toward the highlighted green support zone, which will determine whether the recent rally was a pause within an uptrend or the start of a deeper pullback.

🎯 Entry Decision

No action is warranted until price reacts at the green support zone. The plan is to observe the quality of that reaction before deciding whether a new bullish attempt to break the trendline is realistic.

πŸ’° Execution Plan

Wait for confirmation at support rather than anticipating it. If the zone fails to hold, a revisit to the bottom of the box becomes the expected path, so risk should be sized with that scenario in mind.

πŸ“ˆ Outlook

A strong reaction at the green support zone keeps the bullish trendline break in play. Failure to hold, potentially triggered by geopolitical escalation in the Middle East, shifts focus toward a retest of the box's lower boundary.

Get Full Access to All Our Content for Free!
You can find our other outlets at the bottom of the website.
Telegram