⚡️ Market / Price Context
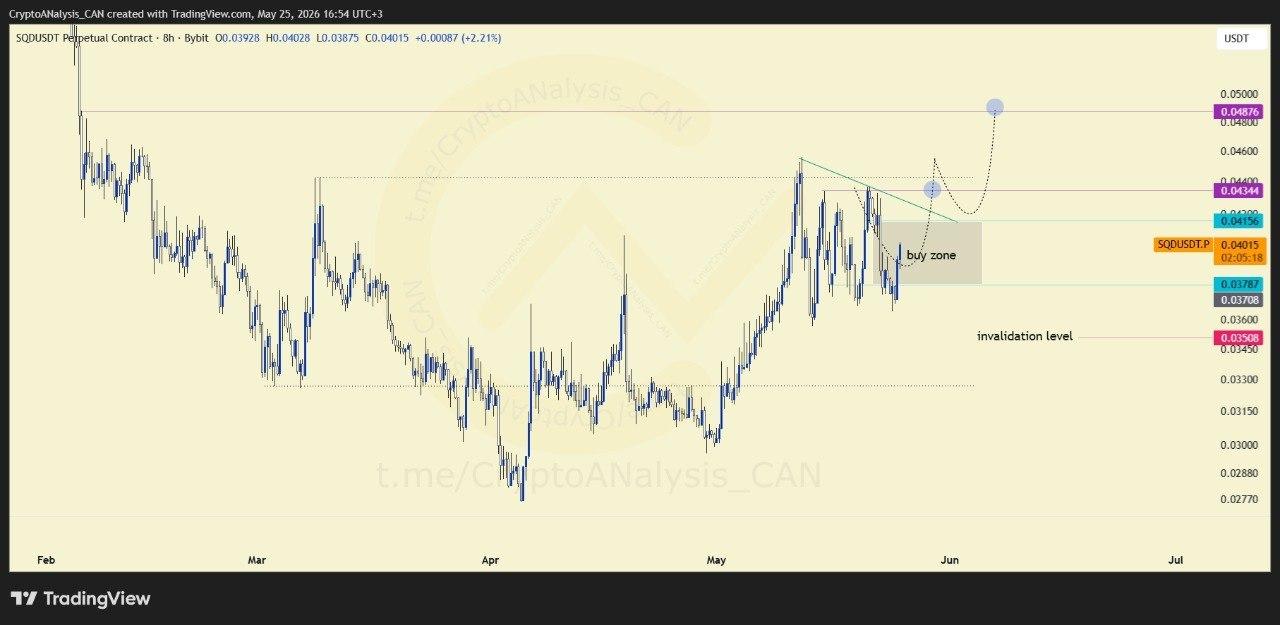
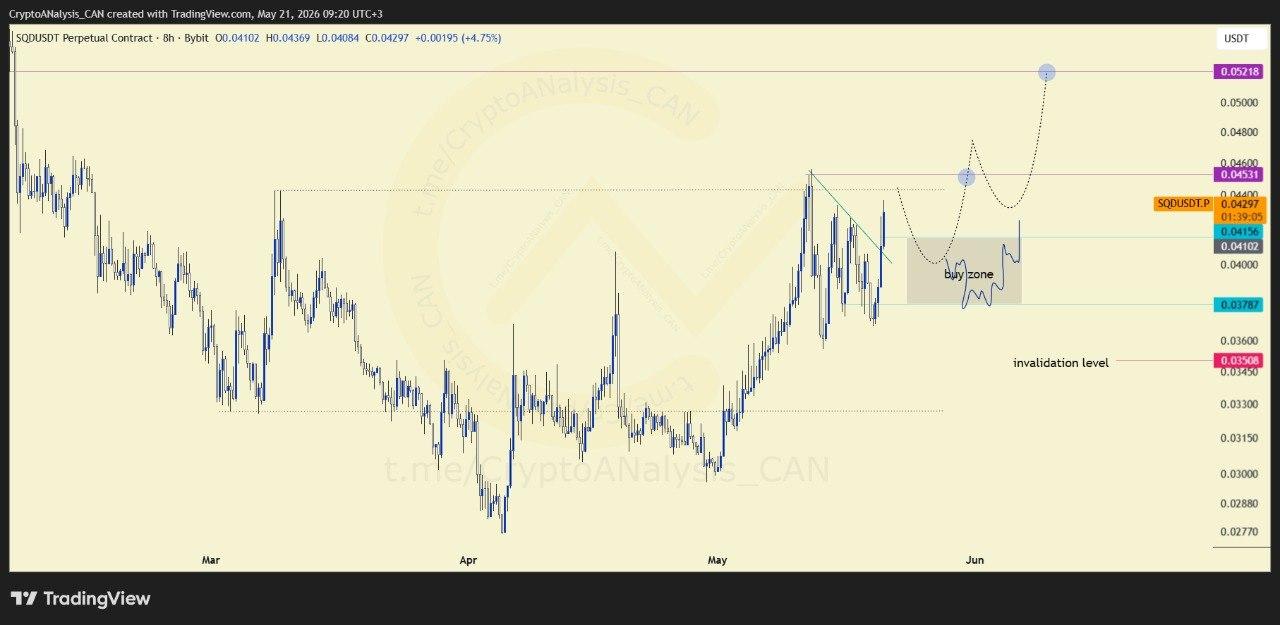
SQD/USDT has spent recent sessions consolidating, building what looks like a ranging base on the 8H timeframe. That sideways action often reflects accumulation before a directional move and here, price has begun pushing above that range, hinting at renewed upside momentum.
📈 Chart Explanation
The structure is straightforward: a defined trading range followed by a breakout attempt to the upside. In technical terms, this pattern often signals that buyers have absorbed supply within the range and are now testing higher levels. Pullbacks toward the broken range are a natural part of this process, as price frequently retests prior resistance-turned-support before continuing.
📈 Outlook
If SQD/USDT holds above the former range, pullbacks could offer areas of interest for those tracking continuation setups. However, a move back below the range would suggest the breakout has failed, invalidating the bullish structure and calling for disciplined risk management. This distinction; hold above vs. break below, is the key level to monitor going forward.