⚡️ Market / Price Context
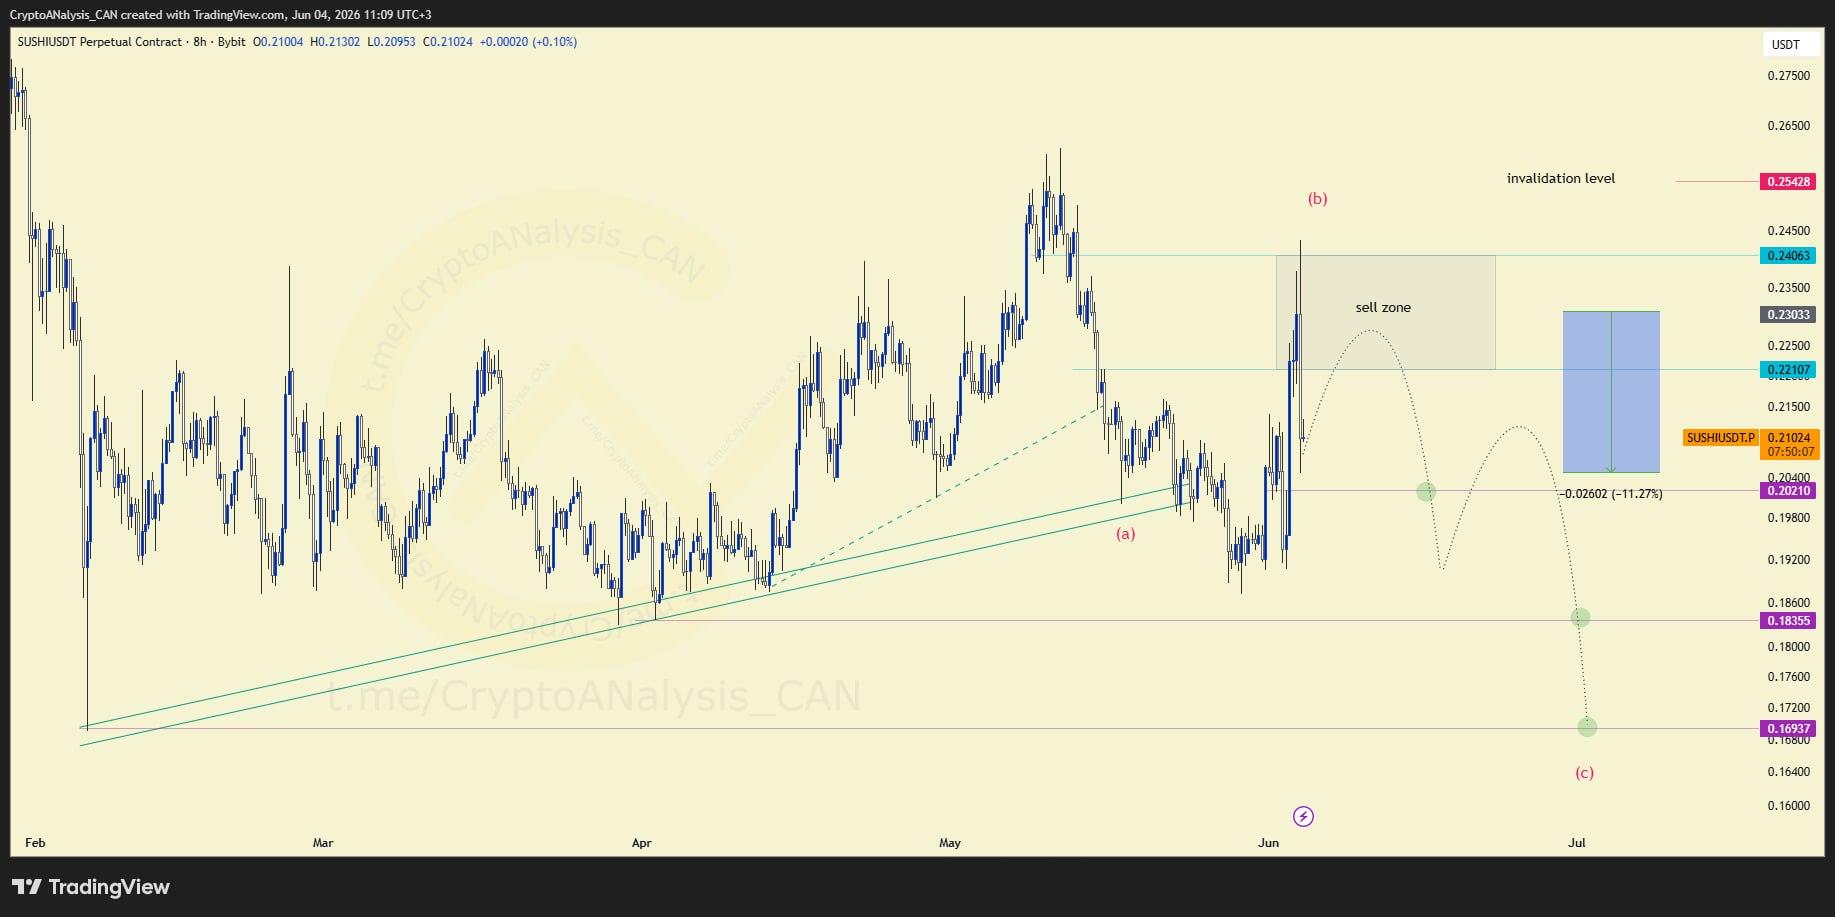
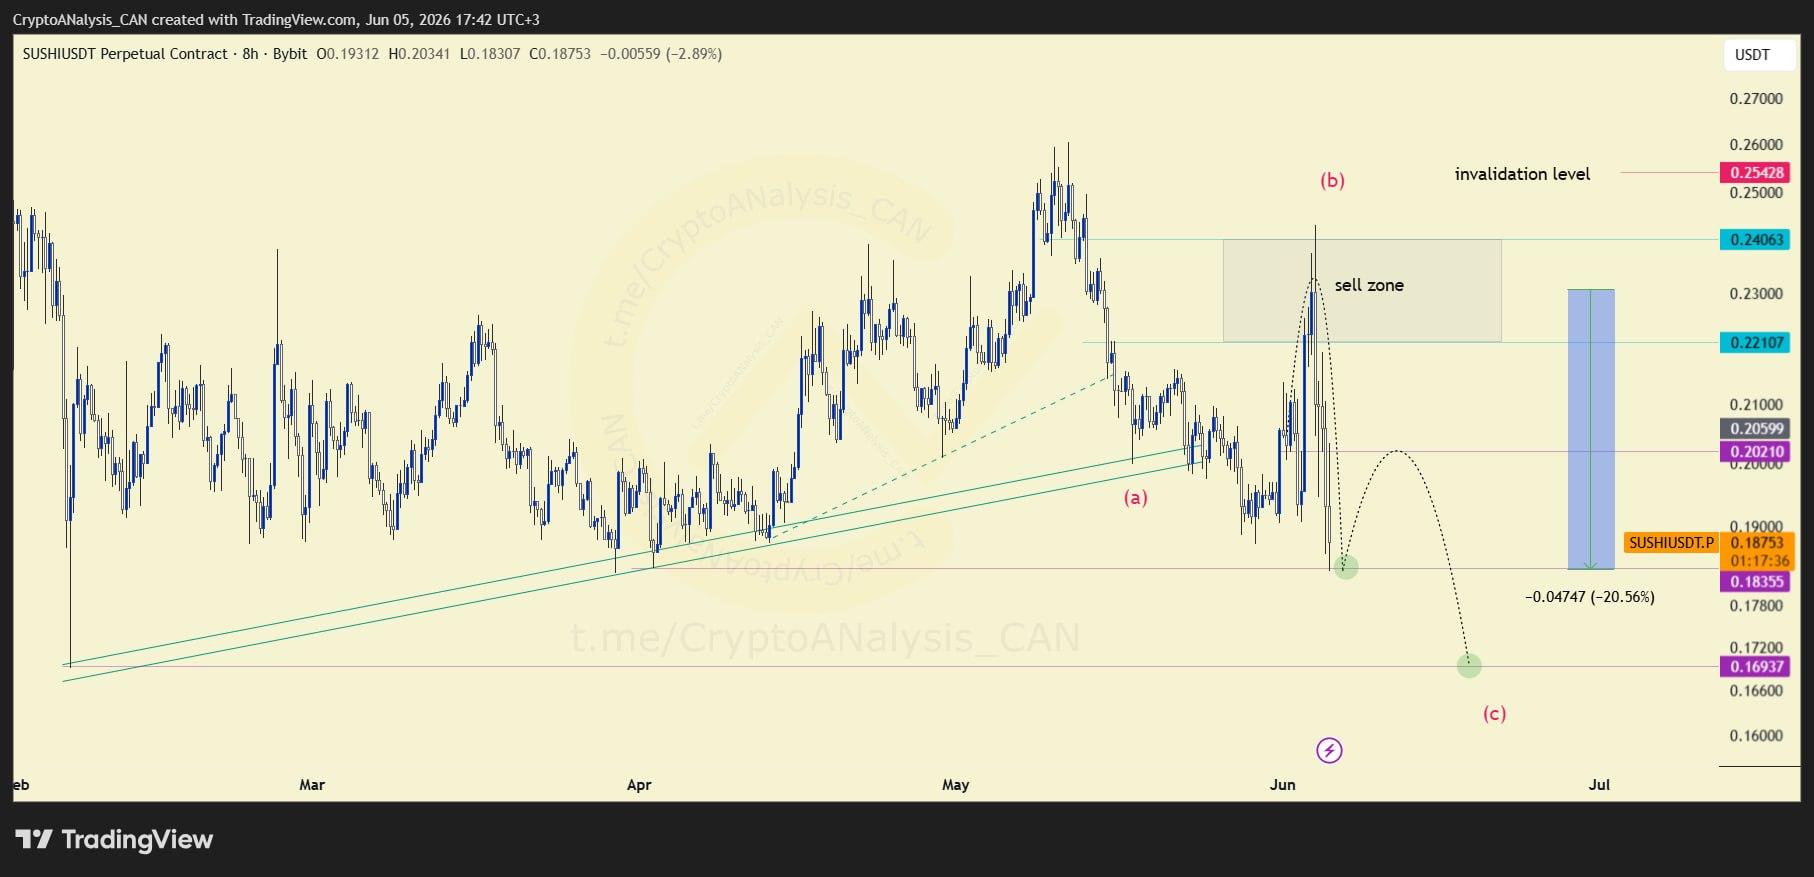
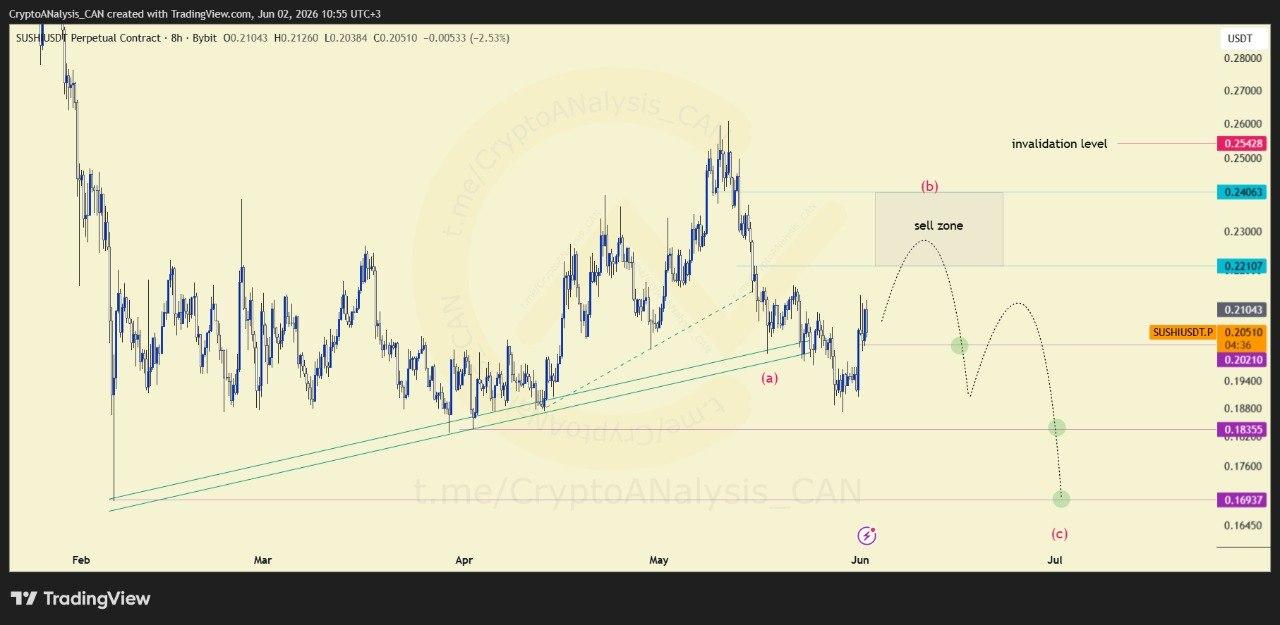
SUSHI/USDT is showing signs of transitioning into a corrective phase on the 8H chart. Based on Elliott Wave structure, price appears to be preparing for a wave (b) retracement, a countertrend move that typically precedes further downside continuation.
📈 Chart Explanation
In Elliott Wave theory, wave (b) represents a corrective pullback within a larger three-wave sequence, often followed by wave (c), a move that extends price toward lower levels before the broader structure resolves. This pattern suggests the current retracement is a structural phase rather than a reversal of the larger trend.
📈 Outlook
Should this wave count play out, price could continue lower into wave (c) territory before the corrective sequence completes. As with any developing wave structure, confirmation comes from price action itself, and proper risk management remains essential while the pattern unfolds.