⚡️ Market / Price Context
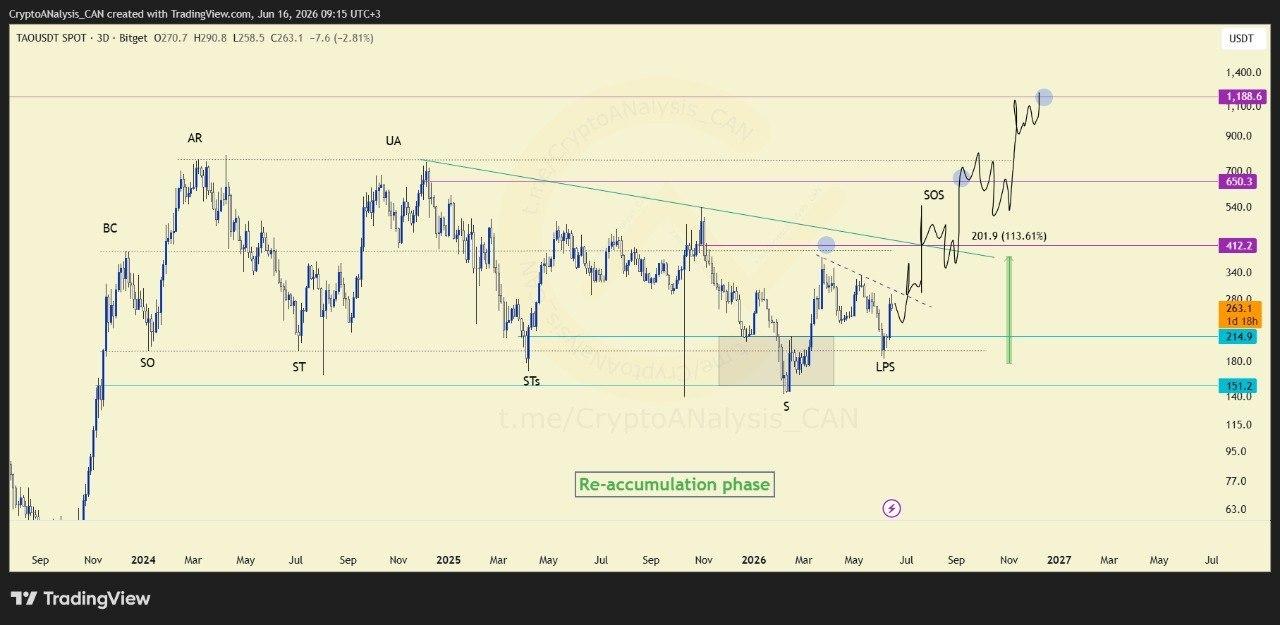
TAO appears to have completed an important accumulation-phase milestone with the formation of a Last Point of Supply (LPS). This development suggests that selling pressure may be fading, allowing the market to transition into a recovery phase.
📈 Chart Explanation
The 3-day chart highlights a developing bullish structure where price is attempting to build momentum toward a Sign of Strength (SOS). Multiple trendlines and resistance levels remain overhead, making each breakout an important confirmation step for the broader recovery thesis.
🎯 Entry Decision
The bullish outlook remains valid as long as the recovery structure continues to develop. However, traders should focus on how price reacts around the highlighted resistance levels, as failure to break these barriers could slow momentum.
💰 Execution Plan
The primary strategy is to monitor successive resistance and trendline tests. Each successful breakout strengthens the probability of reaching projected targets, while risk management should remain a priority throughout the move.
📈 Outlook
TAO is attempting to transition from accumulation into a stronger recovery phase. Continued strength above key resistance levels would support the bullish scenario and improve the likelihood of further upside progression.