⚡️ Market / Price Context
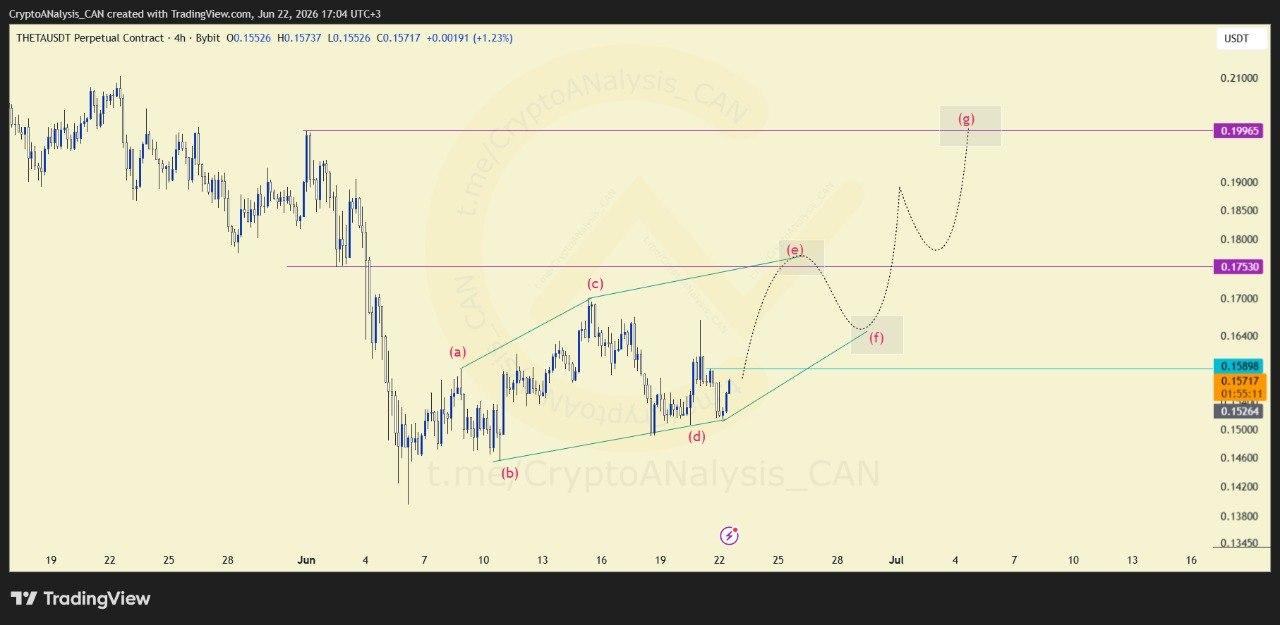
The THETAUSDT 4-hour chart shows price building within a developing structure that may support a larger upward move. Current market conditions suggest momentum is gradually shifting toward an important resistance test.
📈 Chart Explanation
Technical structure indicates a possible diametric pattern, which could drive price toward higher resistance zones. The current setup remains incomplete, with confirmation depending entirely on price behavior at the immediate breakout level.
🎯 Entry Decision
The critical trigger for this setup remains a confirmed break above the highlighted technical resistance near $0.159. Until that level is cleared, confirmation for continuation remains incomplete.
💰 Execution Plan
Once breakout confirmation occurs, each highlighted technical zone can provide structured opportunities for profit-taking, strategic re-entry positioning, and progression toward the final target area.
📈 Outlook
A confirmed move above resistance could unlock continuation toward higher technical levels, while failure to break the key zone keeps the setup unconfirmed.