⚡️ Market / Price Context
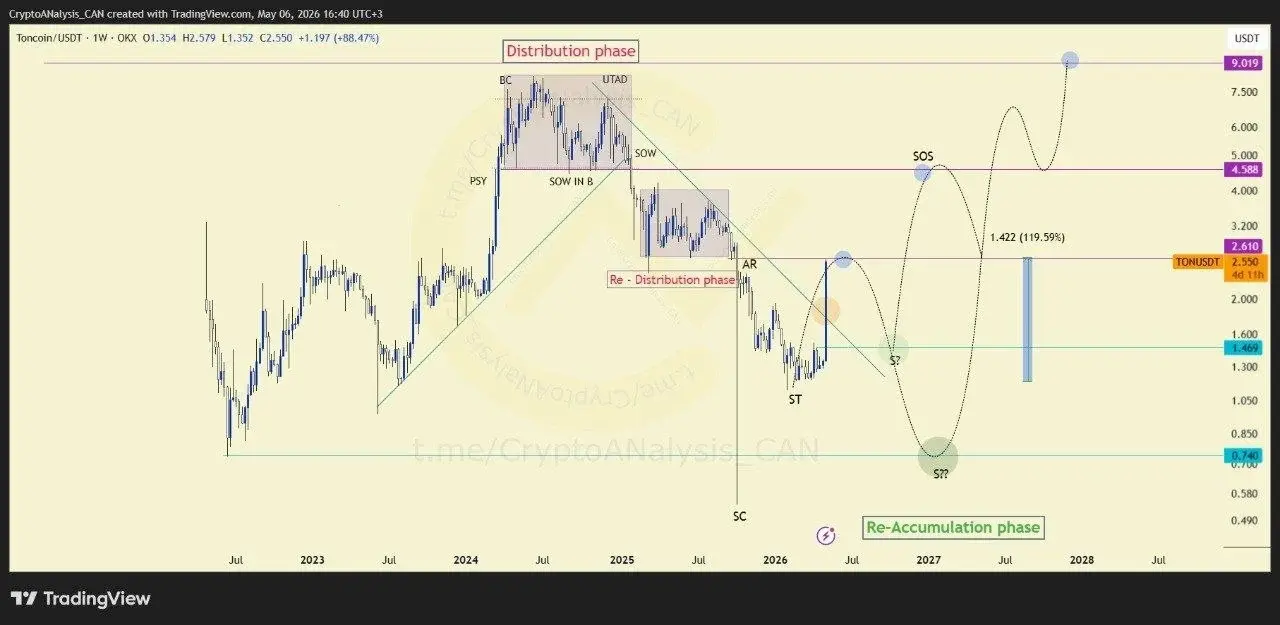
TONUSDT is currently trading near a critical area where bullish momentum could begin to accelerate. Market participants are closely watching for a breakout, as price action appears to be approaching a decision point that may define the next short-term move.
📈 Chart Explanation
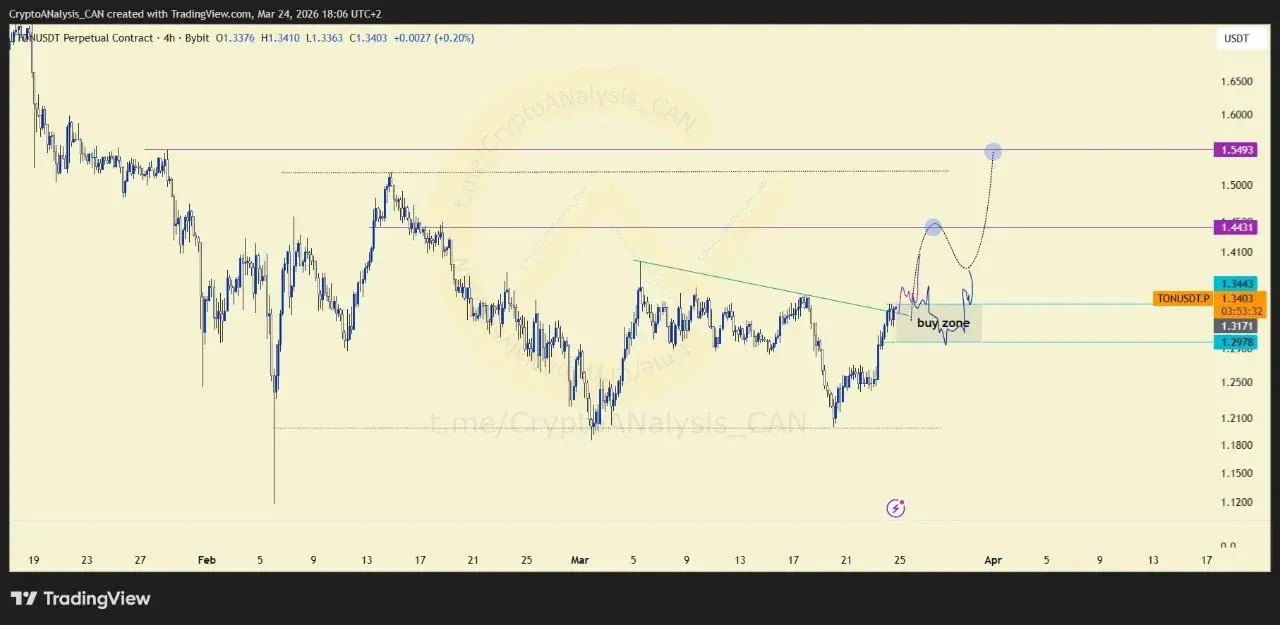
The 4-hour chart highlights a potential breakout structure. If buyers successfully push price through the current resistance zone, momentum could extend toward two predefined target areas marked on the chart. These zones represent the primary objectives of the setup.
🎯 Entry Decision
The preferred scenario is a confirmed breakout from the current range. Entering before confirmation may increase risk, while waiting for a clean move above resistance provides stronger validation of bullish continuation.
💰 Execution Plan
If the breakout develops as expected, the trade can be managed toward the two highlighted target zones. Alternatively, if price pulls back instead of breaking higher, the second support level offers a potential area for averaging into a position while maintaining disciplined risk management.
📈 Outlook
The current structure remains constructive as long as key support levels hold. A successful breakout could open the path toward the identified targets, while a pullback may provide a more favorable risk-adjusted entry opportunity.