⚡️ Market / Price Context
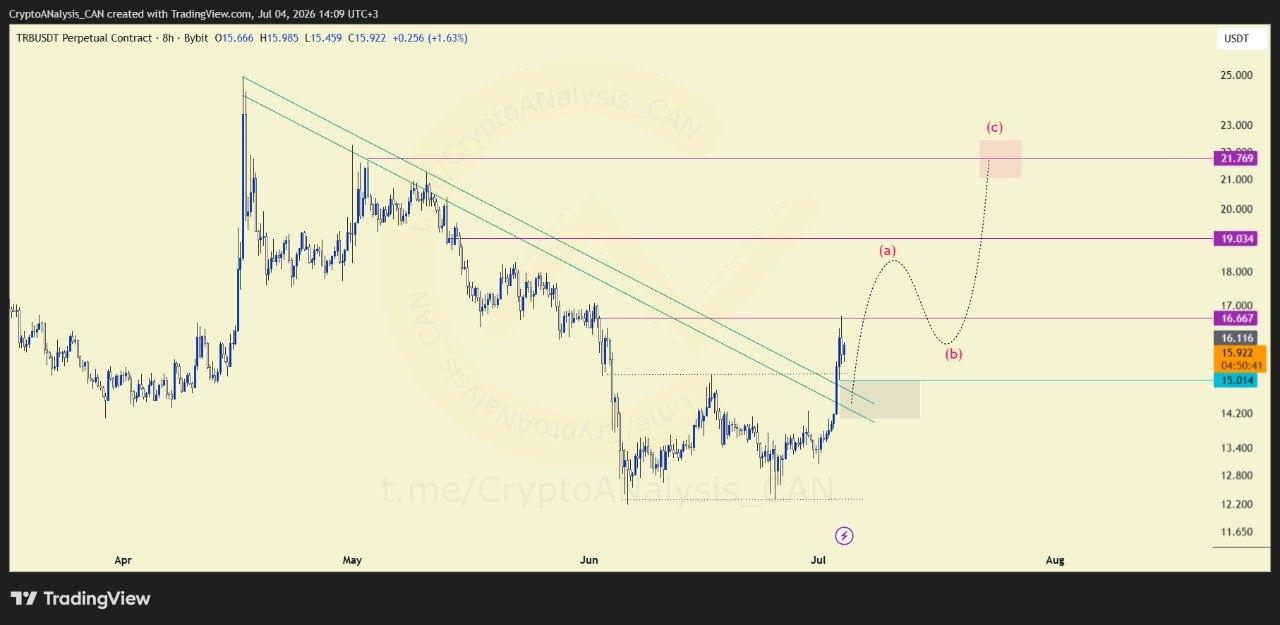
TRB has moved above its previous trading range, shifting the market structure in favor of buyers. The breakout suggests the market could be entering the early stages of Wave (a), marking a potential transition into a new bullish phase.
📈 Chart Explanation
The breakout remains the key technical development on the daily timeframe. Based on the current structure, the market may have room for at least one additional upward leg before Wave (a) reaches completion. A retracement into the highlighted gray demand zone would be consistent with a healthy continuation pattern.
📈 Outlook
As long as the breakout remains valid, the bullish scenario favors another move higher before Wave (a) completes. A constructive pullback into demand could provide the foundation for the next advance.
