⚡️ Market / Price Context
UBUSDT is currently trading below its previous distribution range, indicating a shift in market behavior after a period of consolidation. The structure points to increasing weakness following the latest price developments.
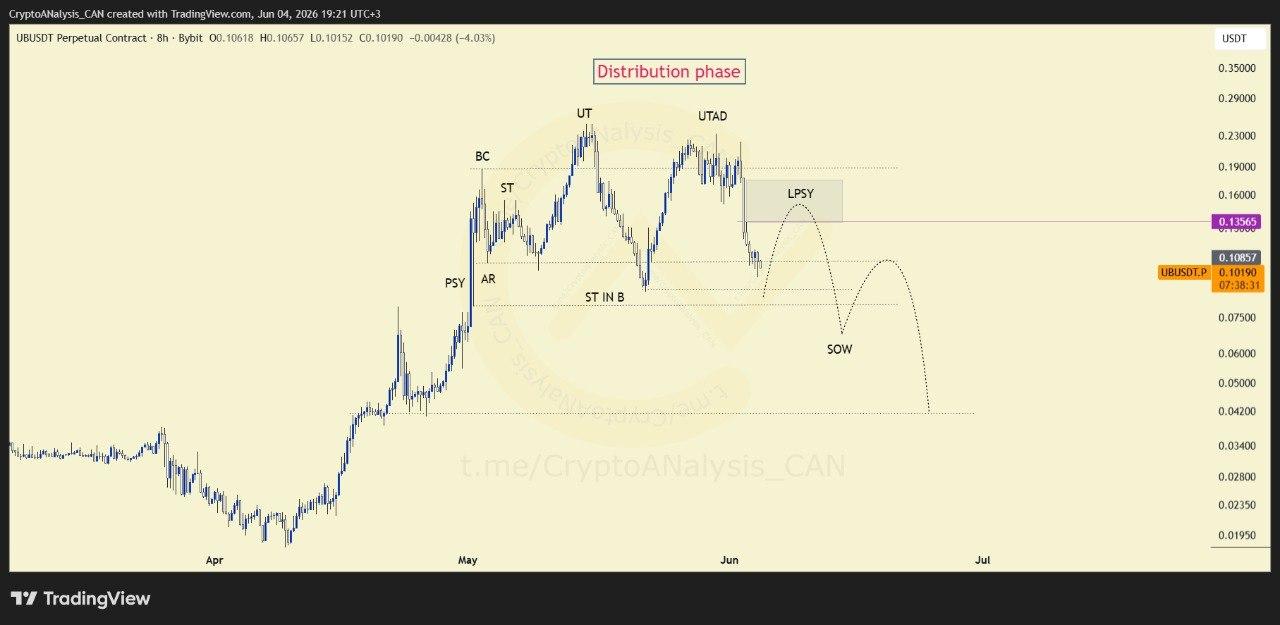
📈 Chart Explanation
The 8-hour chart resembles a classic Wyckoff Distribution pattern. After the formation of UT (Upthrust) and UTAD (Upthrust After Distribution), price began losing strength and moved beneath the range. The highlighted area is being monitored as a potential LPSY (Last Point of Supply), where any recovery attempt could encounter renewed selling pressure.
🎯 Entry Decision
Traders may prefer caution while price remains below the identified supply zone. A relief rally into this area could provide important confirmation of the prevailing structure.
💰 Execution Plan
The current framework favors respecting the dominant trend and monitoring reactions around the LPSY region. Risk management remains essential while market participants assess potential continuation.
📈 Outlook
As long as UBUSDT stays below the highlighted supply zone, the probability of a move toward lower liquidity areas remains elevated.


