⚡️ Market / Price Context
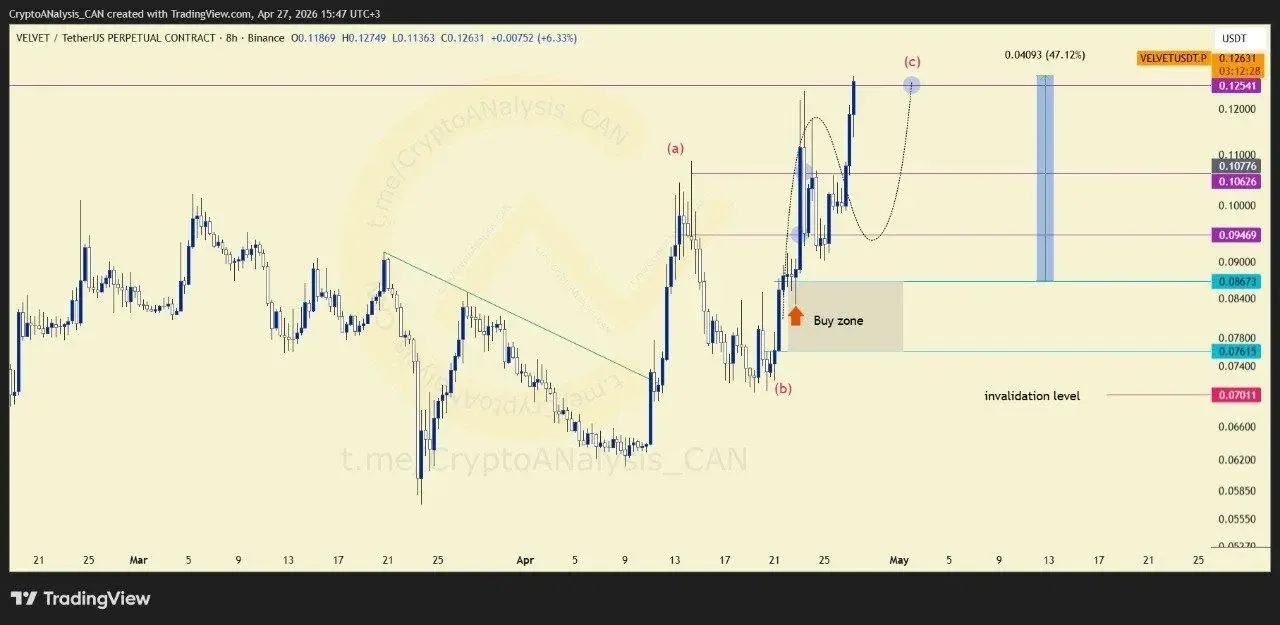
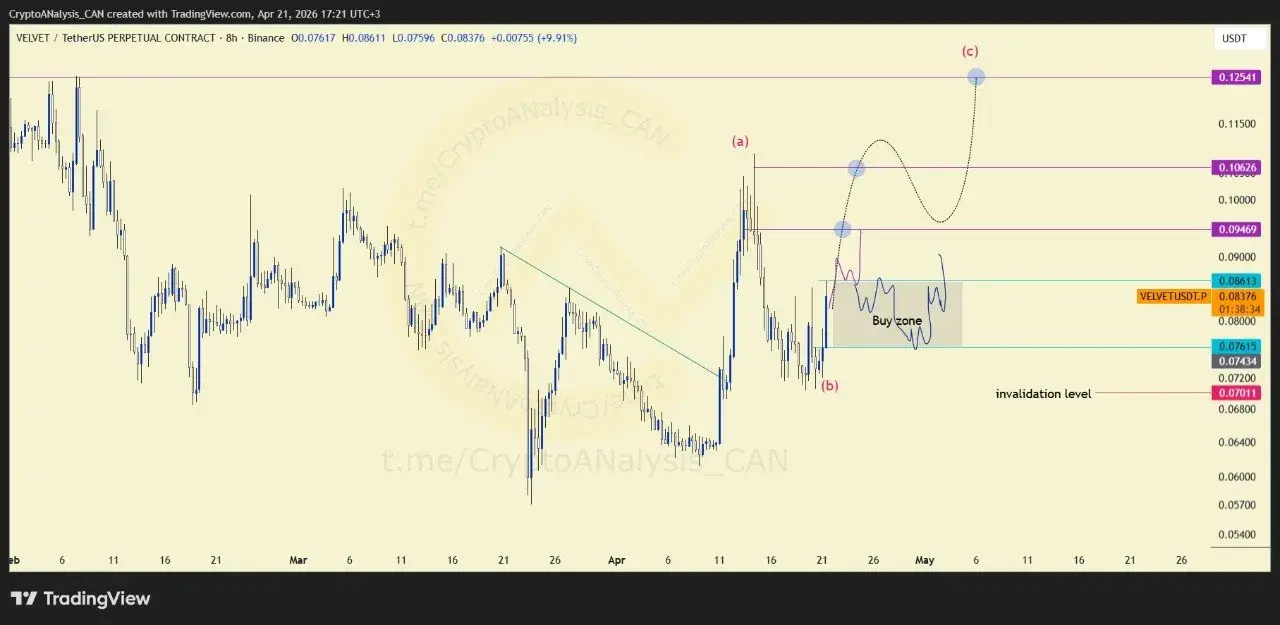
VELVET recently achieved a breakout above a descending trendline, signaling a potential shift in market structure. Following the breakout, price entered a pullback phase, which is a common development as the market tests whether buyers can maintain control.
📈 Chart Explanation
The key technical event is the successful break above the descending trendline. Since then, the market has retraced and is now approaching an important decision point. The highlighted zone acts as a confirmation area that could help determine whether the recovery phase is genuinely underway or if additional consolidation is required.
Rather than focusing solely on the pullback, traders should monitor how price behaves around the highlighted region and whether bullish momentum begins to rebuild.
🎯 Entry Decision
The preferred approach is to wait for price to move above the highlighted zone before considering long exposure. This confirmation can help reduce the risk of entering too early while providing stronger evidence that the recovery trend is developing.
💰 Execution Plan
Once confirmation is established, traders can evaluate entries within the designated buy zone while defining risk parameters in advance. Position sizing, stop-loss placement, and leverage selection should align with the overall trade plan before execution.
📈 Outlook
VELVET remains in a constructive position following its trendline breakout. The next key signal will be whether price can reclaim the highlighted area and confirm the beginning of a stronger recovery phase.