⚡️ Market / Price Context
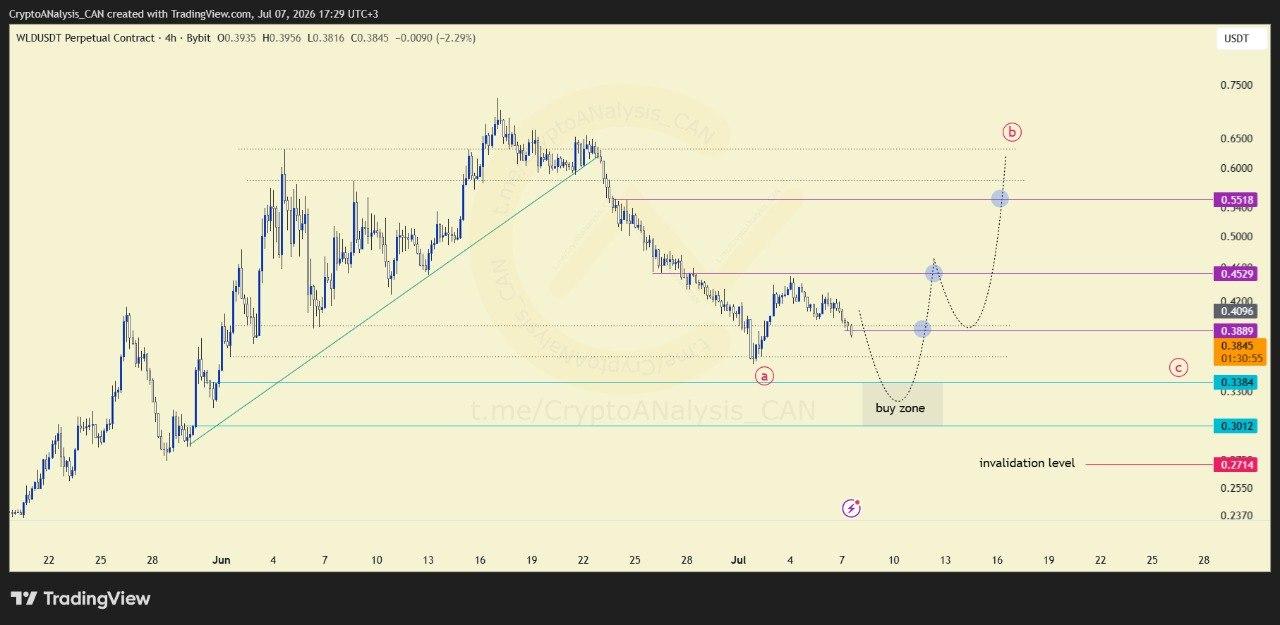
WLD has experienced a sharp correction, falling nearly 50% from its recent high. The ongoing decline reflects persistent selling pressure, keeping the short-term trend under pressure as price approaches significant technical support.
📈 Chart Explanation
The chart highlights two major demand zones positioned below the current market price. These areas represent potential locations where buying interest could emerge and where the broader structure may begin to stabilize.
📈 Outlook
Although WLD remains under selling pressure, the approaching demand zones could become important technical inflection points. A confirmed reaction from these areas would strengthen the case for a potential recovery.
