⚡️ Market / Price Context
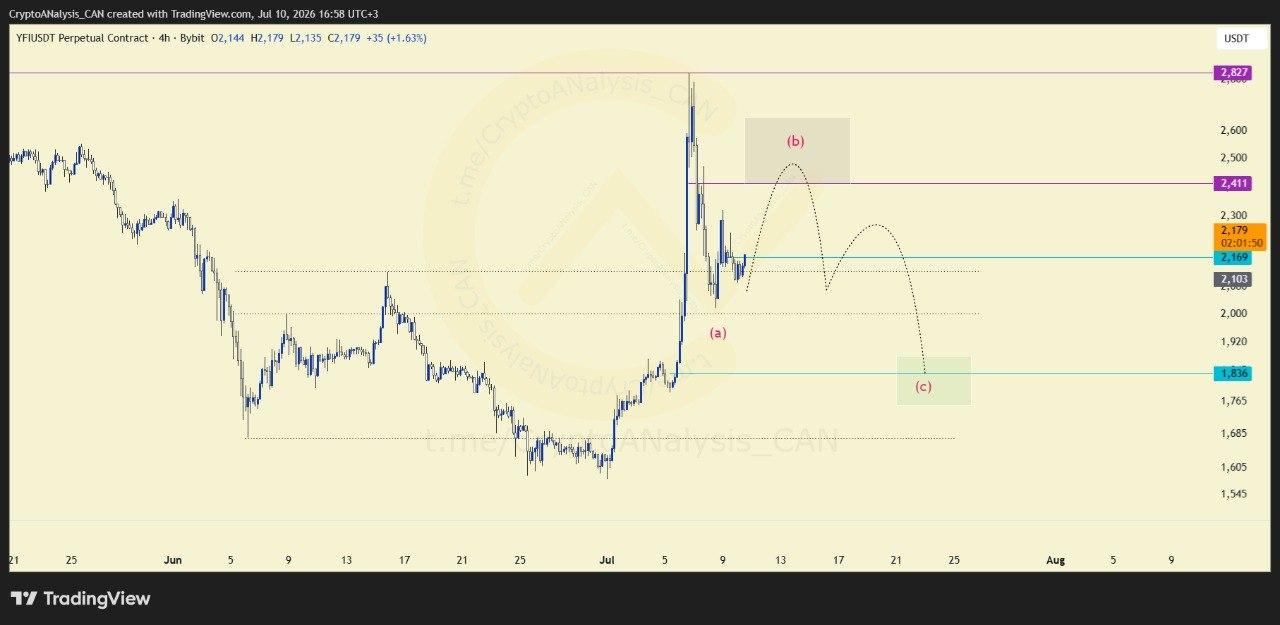
YFI rallied strongly from its recent lows, with buyers driving price back toward previous highs. However, the bullish momentum weakened as sellers responded aggressively, resulting in a notable rejection and shifting the short-term structure into a corrective phase.
📈 Chart Explanation
The current price action suggests the market is undergoing a healthy retracement after the recent advance. Based on the existing structure, this corrective move may form Wave (b) before the broader trend develops further. The highlighted zone represents the primary technical area where this retracement could reach completion.
📈 Outlook
The short-term outlook favors continued monitoring of the corrective structure. If Wave (b) completes within the highlighted zone, the market could present the next technical opportunity while the current correction remains intact.
