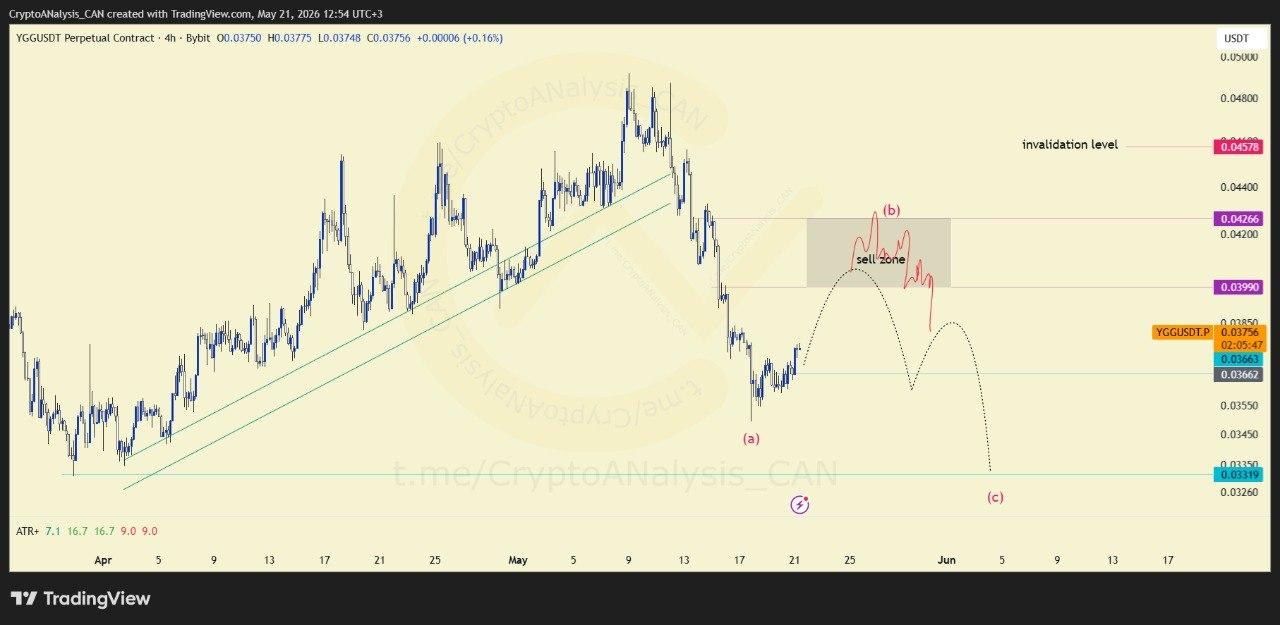
⚡️ Market / Price Context
YGG is showing signs of a changing market structure after losing a long-standing ascending trendline. The breakdown suggests that bullish momentum has weakened, shifting attention toward a potential corrective phase rather than immediate continuation.
📈 Chart Explanation
The current setup follows a clear technical sequence. After the trendline breakdown, price experienced a sharp rejection that can be interpreted as wave (A) of a corrective structure. The market is now attempting a retracement toward resistance, potentially forming wave (B), while traders monitor whether a larger move toward support develops as wave (C).
📈 Outlook
As long as the broken trendline continues to act as resistance, the corrective outlook remains valid. The market's reaction within the retracement phase will be critical in determining whether wave (C) develops toward the next support zones.
